. 1999 Feb;65(2):652-8.
doi: 10.1128/AEM.65.2.652-658.1999.

Functional analyses of the promoters in the lantibiotic mutacin II biosynthetic locus in Streptococcus mutans

Affiliations

Functional analyses of the promoters in the lantibiotic mutacin II biosynthetic locus in Streptococcus mutans

F Qi et al. Appl Environ Microbiol. 1999 Feb.

Abstract

The lantibiotic bacteriocin mutacin II is produced by the group II Streptococcus mutans. The mutacin II biosynthetic locus consists of seven genes, mutR, -A, -M, -T, -F, -E, and -G, organized as two operons. The mutAMTFEG operon is transcribed from the mutA promoter 55 bp upstream of the translation start codon for MutA, while the mutR promoter is 76 bp upstream of the mutR structural gene. Expression of the mutA promoter is regulated by the components of the growth medium, while the mutR promoter activity does not seem to be affected by these conditions. Inactivation of mutR abolishes transcription of the mutA operon but does not affect its own promoter activity. The expressions of both mutA and mutR promoters are independent of the growth stage, while the production of mutacin II is only elevated at the early stationary phase. Taken together, these results suggest that expression of the mutacin operon is regulated by a complex system involving transcriptional and posttranscriptional or posttranslational controls.


Figures

FIG. 1
FIG. 1
Genomic map of mutacin locus. Shown here is an ∼12-kb DNA fragment containing the silent transposase gene (tra), the putative transcription regulator gene (mutR), the prepromutacin gene (mutA), the modifying-enzyme gene (mutM), the transporter gene (mutT), the immunity genes (mutF, -E, and -G), and the fructose bisphosphate aldolase gene (fba). The rho-independent transcription terminator for mutR and the possible transcription attenuator at the mutA-mutM junction are illustrated. The arrows represent promoters.
FIG. 2
FIG. 2
Northern blot analysis of transcripts of mutacin locus. (A) RNAs isolated from the mid-log-phase (lanes M) and stationary-phase (lanes S) cultures of S. mutans T8 and RNA from the nonproducer strain UA159 (lanes 159) were hybridized separately with 32P-labeled probes specific to the seven genes in the mutacin locus. “Mid-log-phase cultures” refers to samples taken at an OD600 of 2.0 in CDM-TSBY medium, and stationary-phase cultures are samples taken at an OD600 of 4.5. S. mutans T8 and its derivatives grown in CDM-TSBY medium have a doubling time of 1 h, and the growth curve levels off at an OD600 of 4.5, as measured on a Beckman DU7400 spectrophotometer. (B) To confirm that mutA is the only promoter in the mutAMTFEG operon, the same gene probes were used to hybridize with RNAs isolated from the wild-type strain (WT) and the promoter deletion mutant strain (ΔP). The RNA molecular weight markers are labeled on the left. Note that in both autoradiographs the positions of the 23S and 16S RNAs are shown as light bands due to the existence of an excessive amount of the RNA, which blocked hybridization of the probes to their respective target RNAs.
FIG. 3
FIG. 3
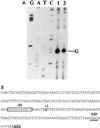
Primer extension mapping of the mutA transcripts. (A) Autoradiograph of the sequencing gel used to analyze the reverse transcripts. Lanes G, A, T, and C, sequencing ladders generated by the same primer used in the primer extension reaction; lanes 1 through 6, RNA samples isolated from early-log-phase to stationary-phase cultures at about 45-min intervals (Fig. 4). The initiation nucleotide (G) and the position of the loading well on the gel (W) are labeled on the right. Note that the DNA template used for the sequencing reaction contained an A-to-G point mutation in the promoter −10 region. (B) DNA sequence of the mutA promoter region. The −35 and −10 regions are boxed. The transcription initiation site for the mutA promoter (+1), the Shine-Dalgarno sequence (S/D), and the initiation codon for MutA (mutA) are indicated above the sequence. The arrows represent the three inverted repeats (IR I to III), and the underlined bold letters denote the three direct repeats (DR I to III).
FIG. 4
FIG. 4
Time course of mutA promoter expression and mutacin production. The levels of mutA transcript synthesis during the course of cell growth were measured by quantifying the reverse transcripts shown in Fig. 3A with a PhosphorImager. The relative transcript levels were calculated by arbitrarily assigning the highest PhosphorImager counts as 100%. To measure the levels of mutacin production, supernatants from the same samples used for the primer extension mapping shown in Fig. 3 were subjected to mutacin extraction and activity assays, as described in Materials and Methods. To ensure reproducibility of the data, the experiments were repeated at least three times with RNA isolated from three independent cultures. The data presented here are from a typical experiment. AU, arbitrary units.
FIG. 5
FIG. 5
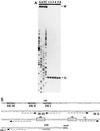
Primer extension mapping of the mutM transcripts. RNA was isolated from S. mutans T8 cell cultures from mid-log to stationary phase at 1-h intervals. (A) Autoradiograph showing the reverse transcripts generated from the mutM primer. The nucleotides at the 5′ ends of the four smaller transcripts are labeled on the right (CCTT). These four nucleotides correspond to the nucleotides at the lower part of the proposed stem-loop structure in the RNA (indicated by the arrows in panel C). (B) With prolonged electrophoresis, the upper band on the autoradiograph was resolved and was determined to correspond to a transcript initiated at the same G residue as that of the mutA transcript. (C) Proposed secondary structure of RNA in the mutA-mutM intergenic region. The Shine-Dalgarno sequence and the translation start codon for MutM are shown by bold letters. The secondary structure was generated by using the RNA Fold program (Genetics Computer Group). See the legend to Fig. 3A for an explanation of the lane labels.
FIG. 6
FIG. 6
Primer extension mapping of the mutR transcripts. (A) RNA was isolated from mid-log- and early-stationary-phase cultures (lanes 1 and 2, respectively) of S. mutans T8 and hybridized with the mutR primer labeled at its 5′ end. The same primer was used to generate sequencing ladders (lanes G, A, T, and C). The 5′ end of the major transcript corresponds to a G residue. Note the extensive read-through from the upstream gene(s). (B) Sequence of the mutR promoter region. The extended −10 region and the transcription start site (+1) are indicated. The Shine-Dalgarno (S/D) sequence and the translation start codon for MutR are double underlined and underlined, respectively.
FIG. 7
FIG. 7
Effects of mutR mutation on activities of the mutA and mutR promoters. (A) quantitative primer extension mapping of the mutA transcripts. The wild-type strain T8 and the mutant strain T8mutR were grown in CDM-TSBY medium, and samples were taken at 1-h intervals starting at an OD600 of 0.5. Total RNA was extracted and used as a template for primer extension with the mutA primer described in the legend to Fig. 3. Lanes 1 to 4, samples from time points 1 to 4 of the wild-type culture; lanes 5 to 8, samples from time points 1 to 4 of the mutR mutant culture. T8 and T8mutR have the same growth rate. (B) quantitative primer extension mapping of the mutR transcripts. The primer used here was the same as that for Fig. 6. Lanes 1 and 2, samples from time points 2 and 4 of the wild-type culture in panel A; lanes 3 and 4, samples from time points 2 and 4 of the mutant culture in panel A. The sequences around the initiation sites (C) are shown on the left of each panel. Lanes G, A, T, and C contain sequencing ladders.
FIG. 8
FIG. 8
Expression of the mutA and mutR promoters in cells grown in CDM or CDM plus TSBY medium. S. mutans T8 cells were grown anaerobically in either CDM or CDM plus TSBY medium to mid-log phase (the doubling time in CDM was 2 h, and the growth curve levels off at an OD600 of 2.0; in CDM-TSBY medium, the doubling time was 1 h and the growth curve levels off at an OD600 of 4.5). “Mid-log” refers to an OD600 of 1.0 in CDM and 2.0 in CDM-TSBY medium. RNA was isolated, and equal amounts (20 μg) were used to hybridize with the same amount of 32P-labeled mutA or mutR primer. An autoradiograph of the sequencing gel is shown; each lane contained equal amounts of the reaction mixture. The arrow on the left indicates the mutA transcripts, and the arrow on the right indicates the mutR transcripts. The difference between the levels of the mutA transcripts synthesized in the two different media is about sevenfold.

Similar articles

Cited by

References

    1. Bibb M. The regulation of antibiotic production in Streptomyces coelicolor A3(2) Microbiology. 1996;142:1335–1344. - PubMed
    1. Caufield P W, Chen P, Qi F, Novak J. Presented at the 5th Conference on Streptococcal Genetics, Vichy, France. 1998.
    1. Chen P, Novak J, Kirk M, Barnes S, Qi F, Caufield P W. Structure-activity study of the lantibiotic mutacin II from Streptococcus mutans T8 by a gene replacement strategy. Appl Environ Microbiol. 1998;64:2335–2340. - PMC - PubMed
    1. Chen P, Novak J, Qi F, Caufield P W. Diacylglycerol kinase is involved in regulation of expression of the lantibiotic mutacin II of Streptococcus mutans. J Bacteriol. 1998;180:167–170. - PMC - PubMed
    1. Chen P, Novak J, Qi F, Caufield P W. Presented at the Third International Workshop on Lantibiotics and Related Modified Antibiotic Peptides, Blaubeuren, Germany. 1998.

Publication types

Associated data

LinkOut - more resources