. 1999 Jan 15;13(2):202-12.
doi: 10.1101/gad.13.2.202.

Transcriptional repression by the Caenorhabditis elegans germ-line protein PIE-1

Affiliations

Transcriptional repression by the Caenorhabditis elegans germ-line protein PIE-1

C Batchelder et al. Genes Dev. .

Abstract

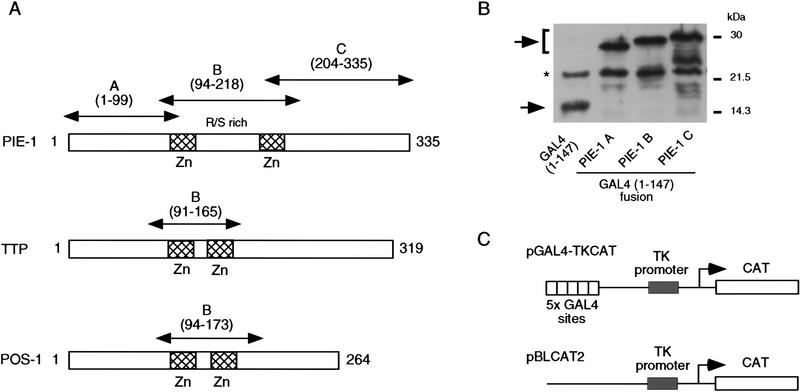
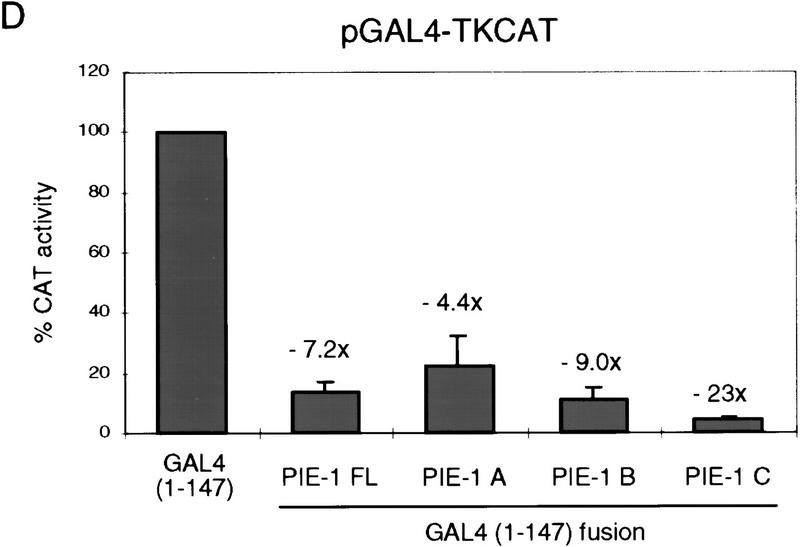
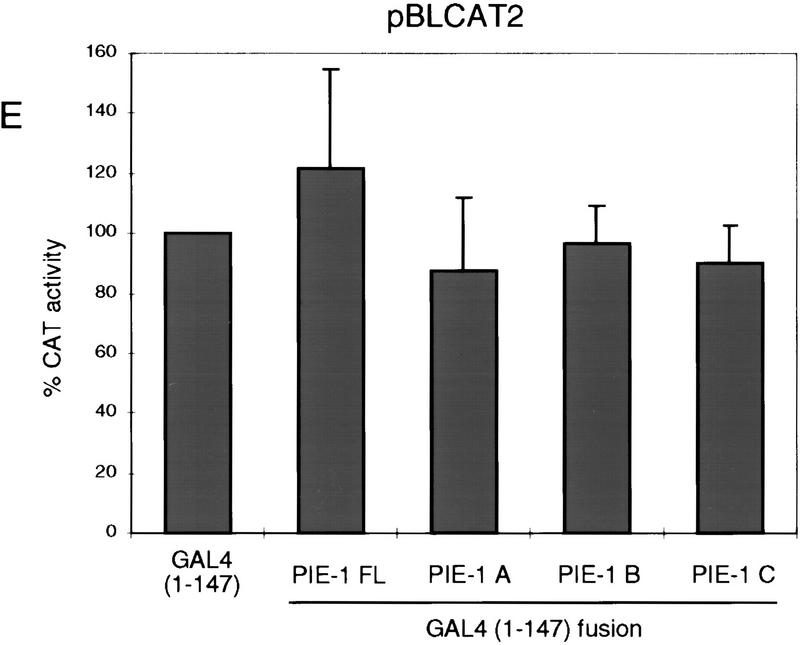
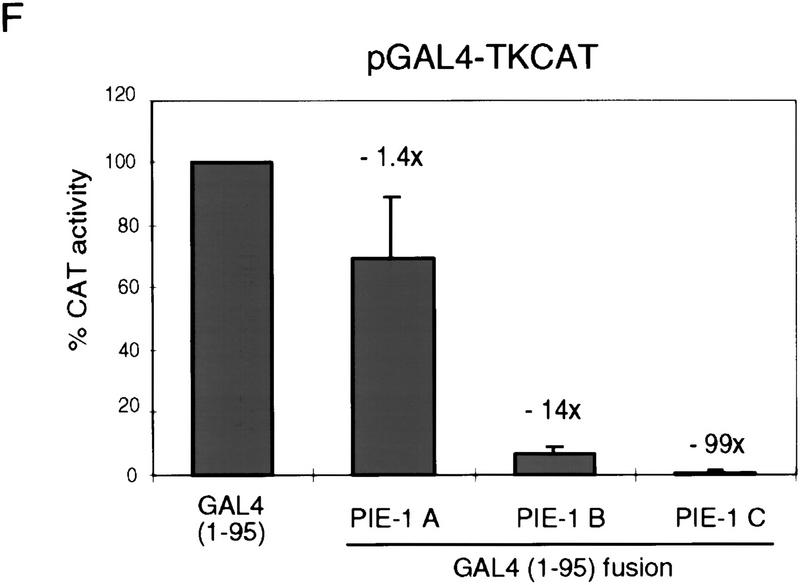
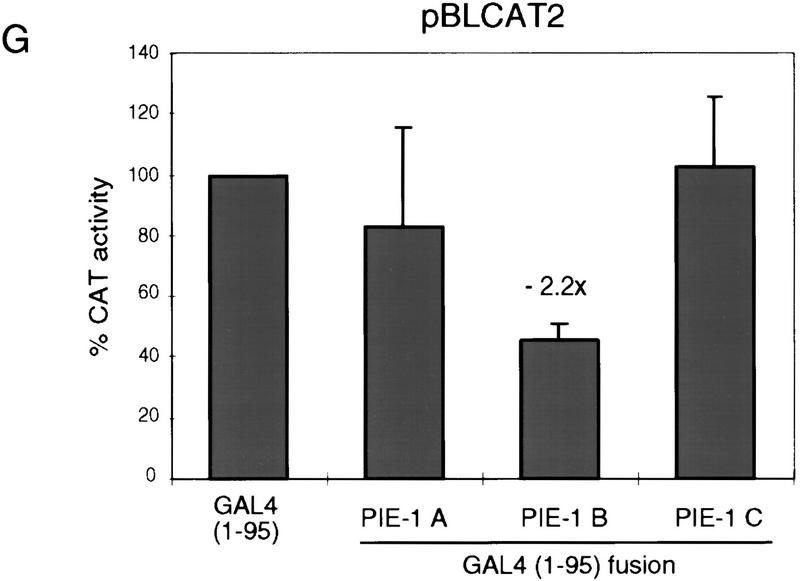
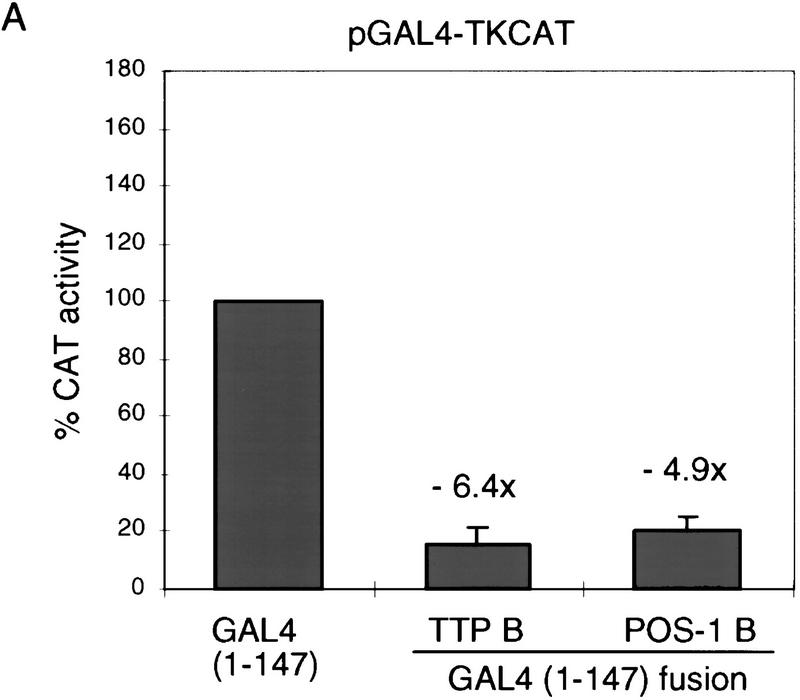
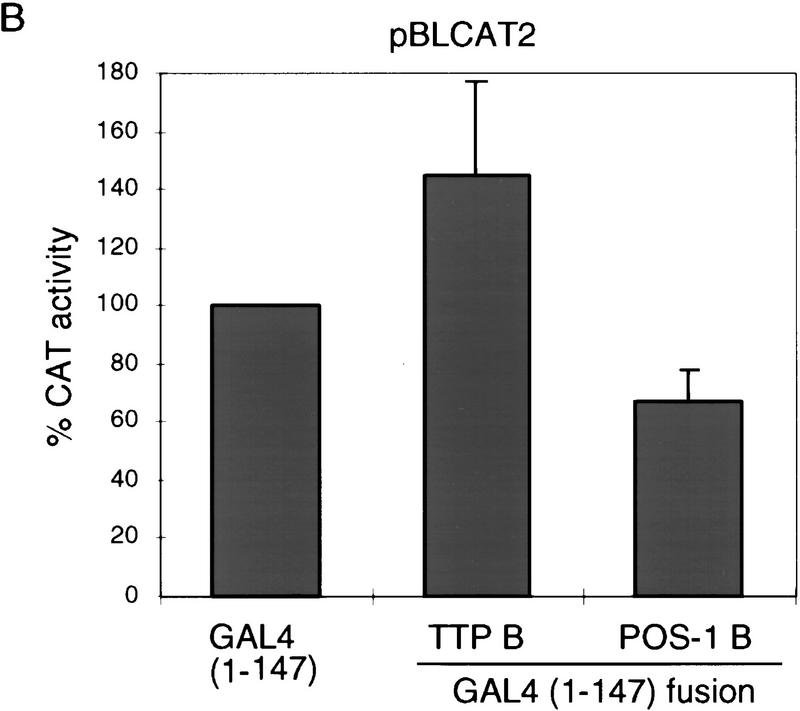
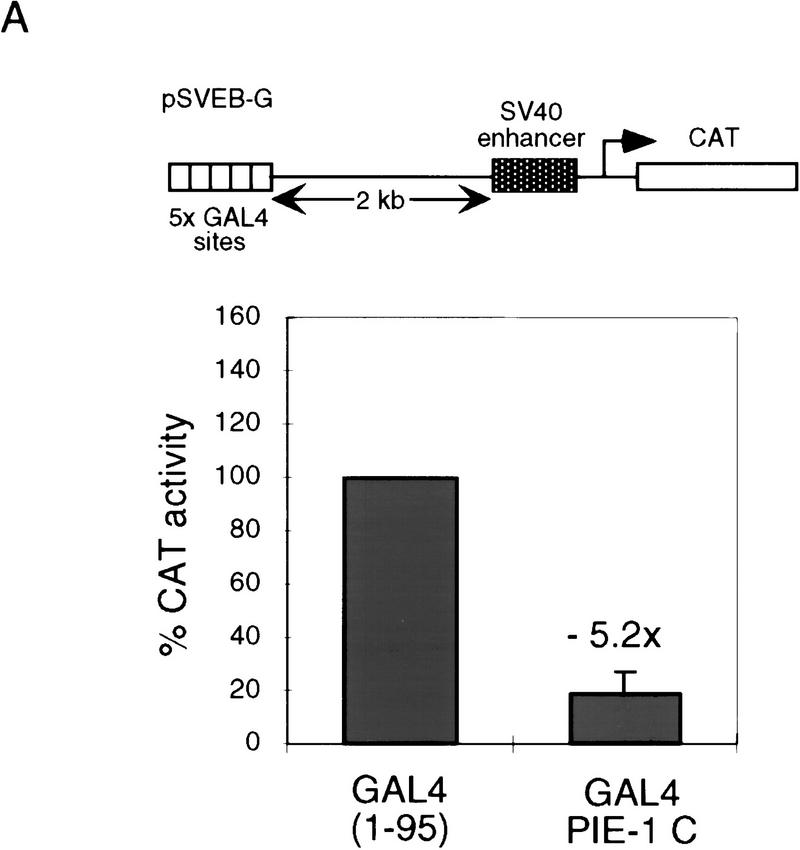
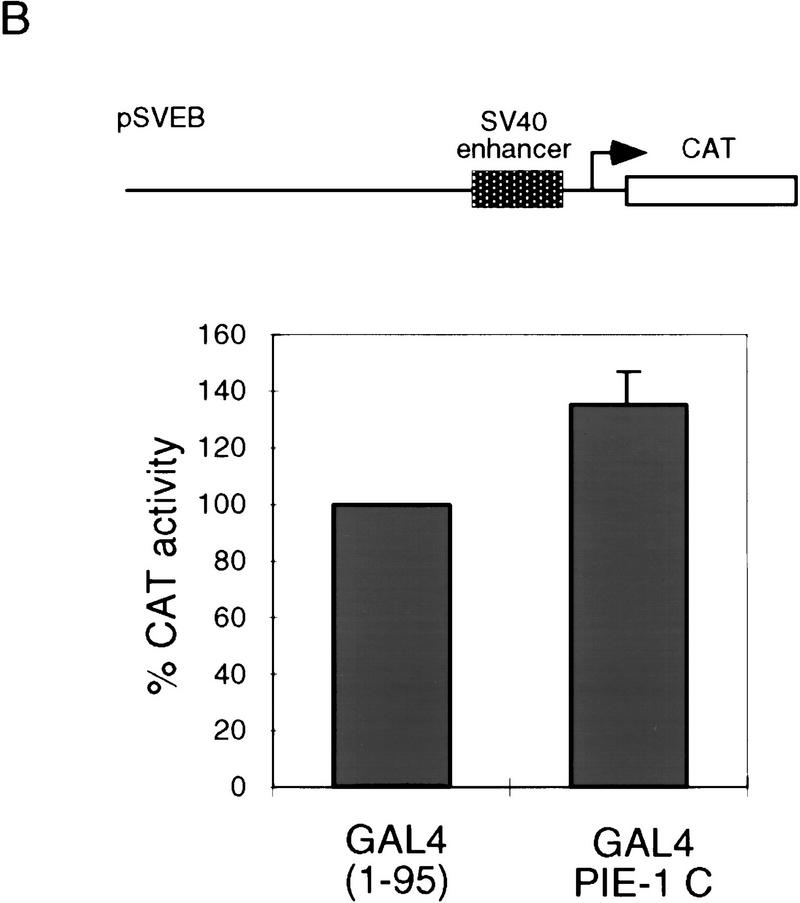
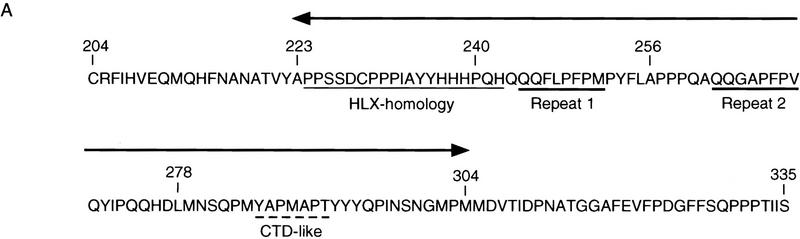
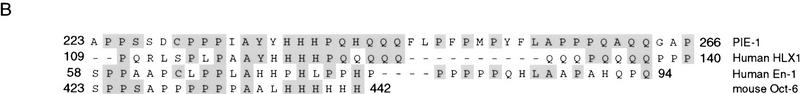
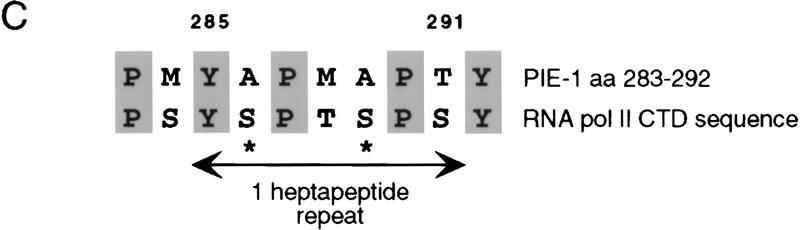
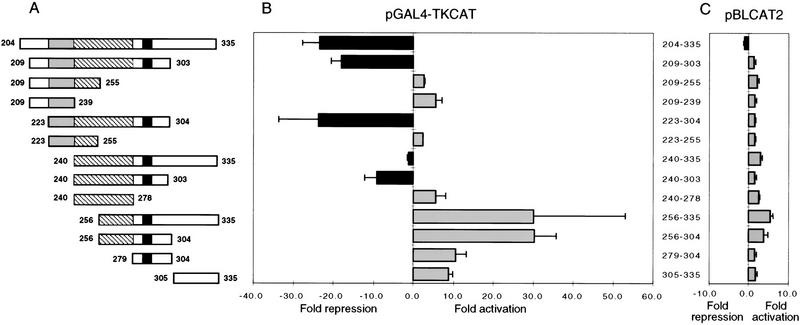
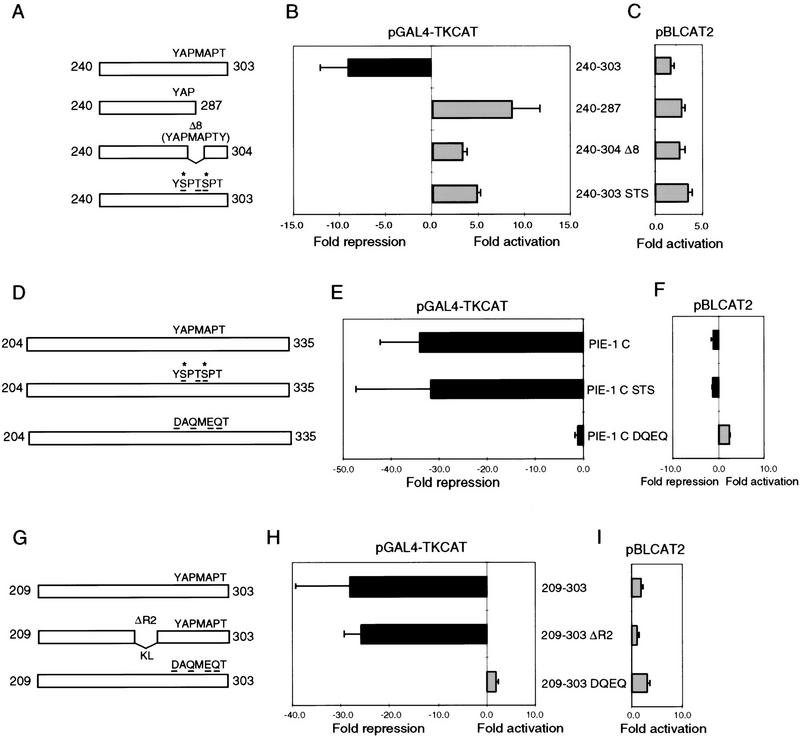
In the early Caenorhabditis elegans embryo, maternally expressed PIE-1 protein is required in germ-line blastomeres to inhibit somatic differentiation, maintain an absence of mRNA transcription, and block phosphorylation of the RNA polymerase II large subunit (Pol II) carboxy-terminal domain (CTD). We have determined that PIE-1 can function as a transcriptional repressor in cell culture assays. By fusing PIE-1 sequences to the yeast GAL4 DNA-binding domain, we have identified a PIE-1 repression domain that appears to inhibit the transcriptional machinery directly. A sequence element that is required for this repressor activity is similar to the Pol II CTD heptapeptide repeat, suggesting that the PIE-1 repression domain might target a protein complex that can bind the CTD. An alteration of this sequence element that blocks repression also impairs the ability of a transgene to rescue a pie-1 mutation, suggesting that this repressor activity may be important for PIE-1 function in vivo.


Figures

Figure 1
Figure 1
PIE-1 contains a powerful transcriptional repression domain. (A) Schematic diagram of the PIE-1 (Mello et al. 1996), mouse TTP (Lai et al. 1990), and C. elegans POS-1 (Tabara et al. 1999) C3H zinc finger proteins. Residues that are fused to the GAL4(1–147) DNA-binding domain are marked by arrows and indicated in parentheses. The boundaries of these regions were chosen on the basis of the location of the respective zinc fingers. The PIE-1 zinc finger regions span residues 99–123 and 185–208, those of TTP span 96–120 and 134–158, and those of POS-1 span 99–122 and 142–166. (B) Expression of GAL4(1–147) PIE-1 fusions in HeLa cells. Immunoblot of whole cell extracts from transfected HeLa cells probed with anti-GAL4(1–147) antibodies. Arrows indicate specific bands, and the asterisk a nonspecific band. Other GAL4(1–147) fusion proteins were expressed at similar levels (not shown). (C) Reporter constructs. pGAL4–TKCAT contains five GAL4 sites upstream of a HSV TK promoter that drives the CAT reporter gene (Shi et al. 1991). pBLCAT2 is an equivalent plasmid without GAL4 sites (Luckow and Schutz 1987). (D) Tethered repression by GAL4(1–147) PIE-1 fusions. HeLa cells were cotransfected with 1 μg of GAL4(1–147) effector plasmid and 5 μg of pGAL4–TKCAT reporter plasmid. Each data point represents the mean relative CAT activity compared to that of GAL4(1–147) alone (100%). Fold repression is indicated above each bar. (E) Assayed as in D, except with 5 μg of pBLCAT2 reporter plasmid. (F) Tethered repression by GAL4(1–95) PIE-1 fusions. HeLa cells were cotransfected with 1μg of GAL4(1–95) effector plasmid and 10 μg of pGAL4–TKCAT reporter plasmid. These fusion proteins were expressed at comparable levels (not shown). Each data point represents the mean relative CAT activity compared to that of GAL4(1–95) (100%). (G) As in F, except 10 μg of pBLCAT2 reporter plasmid was used. Error bars represent the standard deviation of three separate experiments.
Figure 1
Figure 1
PIE-1 contains a powerful transcriptional repression domain. (A) Schematic diagram of the PIE-1 (Mello et al. 1996), mouse TTP (Lai et al. 1990), and C. elegans POS-1 (Tabara et al. 1999) C3H zinc finger proteins. Residues that are fused to the GAL4(1–147) DNA-binding domain are marked by arrows and indicated in parentheses. The boundaries of these regions were chosen on the basis of the location of the respective zinc fingers. The PIE-1 zinc finger regions span residues 99–123 and 185–208, those of TTP span 96–120 and 134–158, and those of POS-1 span 99–122 and 142–166. (B) Expression of GAL4(1–147) PIE-1 fusions in HeLa cells. Immunoblot of whole cell extracts from transfected HeLa cells probed with anti-GAL4(1–147) antibodies. Arrows indicate specific bands, and the asterisk a nonspecific band. Other GAL4(1–147) fusion proteins were expressed at similar levels (not shown). (C) Reporter constructs. pGAL4–TKCAT contains five GAL4 sites upstream of a HSV TK promoter that drives the CAT reporter gene (Shi et al. 1991). pBLCAT2 is an equivalent plasmid without GAL4 sites (Luckow and Schutz 1987). (D) Tethered repression by GAL4(1–147) PIE-1 fusions. HeLa cells were cotransfected with 1 μg of GAL4(1–147) effector plasmid and 5 μg of pGAL4–TKCAT reporter plasmid. Each data point represents the mean relative CAT activity compared to that of GAL4(1–147) alone (100%). Fold repression is indicated above each bar. (E) Assayed as in D, except with 5 μg of pBLCAT2 reporter plasmid. (F) Tethered repression by GAL4(1–95) PIE-1 fusions. HeLa cells were cotransfected with 1μg of GAL4(1–95) effector plasmid and 10 μg of pGAL4–TKCAT reporter plasmid. These fusion proteins were expressed at comparable levels (not shown). Each data point represents the mean relative CAT activity compared to that of GAL4(1–95) (100%). (G) As in F, except 10 μg of pBLCAT2 reporter plasmid was used. Error bars represent the standard deviation of three separate experiments.
Figure 2
Figure 2
Repressor activity of the TTP (Nup475, TIS11) and POS-1 C3H zinc finger regions. (A) HeLa cells were cotransfected with 1 μg of GAL4(1–147) TTP B or GAL4(1–147) POS-1 B and 5 μg of pGAL4–TKCAT reporter plasmid. (B) As in A, except 5 μg of pBLCAT2 reporter plasmid was used. Data are displayed as in Fig. 1. TTP regions that were tested and found to lack repressor activity in this assay were residues 1–96 and 159–319, and similarly inactive POS-1 regions were 1–99, and 167–264 (not shown).
Figure 2
Figure 2
Repressor activity of the TTP (Nup475, TIS11) and POS-1 C3H zinc finger regions. (A) HeLa cells were cotransfected with 1 μg of GAL4(1–147) TTP B or GAL4(1–147) POS-1 B and 5 μg of pGAL4–TKCAT reporter plasmid. (B) As in A, except 5 μg of pBLCAT2 reporter plasmid was used. Data are displayed as in Fig. 1. TTP regions that were tested and found to lack repressor activity in this assay were residues 1–96 and 159–319, and similarly inactive POS-1 regions were 1–99, and 167–264 (not shown).
Figure 3
Figure 3
The tethered PIE-1 C region can repress transcription from a distance. (A) Repression of the pSVEB-G reporter (Weintraub et al. 1995). HeLa cells were cotransfected with 1 μg of GAL4(1–95) PIE-1 C and 5 μg of reporter. Data are displayed as in Fig. 1. (B) Effect of the PIE-1 C region on the pSVEB control reporter, assayed as in A.
Figure 3
Figure 3
The tethered PIE-1 C region can repress transcription from a distance. (A) Repression of the pSVEB-G reporter (Weintraub et al. 1995). HeLa cells were cotransfected with 1 μg of GAL4(1–95) PIE-1 C and 5 μg of reporter. Data are displayed as in Fig. 1. (B) Effect of the PIE-1 C region on the pSVEB control reporter, assayed as in A.
Figure 4
Figure 4
PIE-1 C region sequence motifs. (A) The PIE-1 C region (Fig. 1A). The HLX homology region, two repeated motifs, and the CTD-like YAPMAPT sequence are indicated. Residues that delimit some PIE-1 carboxy-terminal subregions are marked by residue number, and the complete C region repression domain (Fig. 5B) by arrows. (B) PIE-1 C region sequences aligned with the indicated transcription factors (Suzuki et al. 1990; Logan et al. 1992; Kennedy et al. 1994) using the MegAlign tool. (C) The YAPMAPT motif. This sequence is aligned with a consensus CTD repeat motif (YSPTSPS), which is in the context of adjacent repeats.
Figure 4
Figure 4
PIE-1 C region sequence motifs. (A) The PIE-1 C region (Fig. 1A). The HLX homology region, two repeated motifs, and the CTD-like YAPMAPT sequence are indicated. Residues that delimit some PIE-1 carboxy-terminal subregions are marked by residue number, and the complete C region repression domain (Fig. 5B) by arrows. (B) PIE-1 C region sequences aligned with the indicated transcription factors (Suzuki et al. 1990; Logan et al. 1992; Kennedy et al. 1994) using the MegAlign tool. (C) The YAPMAPT motif. This sequence is aligned with a consensus CTD repeat motif (YSPTSPS), which is in the context of adjacent repeats.
Figure 5
Figure 5
Dissection of the PIE-1 C region repression domain. (A) Schematic representation of PIE-1 C and its subregions, all tested as GAL4(1–147) fusions in B. The HLX homology region shaded, repeats (hatched areas), and YAPMAPT motif (solid areas) (Fig. 4A) are indicated. (B) Repression or activation by GAL4 PIE-1 C subregions. HeLa cells were cotransfected with 1 μg of GAL4(1–147) fusion construct and 5 μg of pGAL4–TKCAT reporter plasmid. (C) Effects of the PIE-1 C subregions on the pBLCAT2 reporter (5 μg), assayed as in B. Each bar represents the mean relative CAT activity, compared to that of GAL4(1–147) and reporter. Error bars indicate the standard deviation derived from three separate transfections.
Figure 6
Figure 6
The YAPMAPT motif is required for the PIE-1 C region repressor activity. (A) Mutation of the YAPMAPT motif in the 240–303 subregion. Residues that correspond to phosphorylated CTD serines (Dahmus 1996) are marked by an asterisk. (B) Repression or activation by the GAL4(1–147) fusions described in A. HeLa cells were cotransfected with 1 μg of GAL4(1–147) fusion construct and 5 μg of pGAL4–TKCAT reporter. (C) Effects of the proteins described in A on the pBLCAT2 reporter plasmid, assayed as in B. (D) Mutation of the YAPMAPT sequence within the complete PIE-1 C region, diagrammed as in A. (E) Repression of pGAL4–TKCAT by the GAL4(1–147) fusions described in D, assayed as in B. In this experiment, repression by GAL4(1–147) PIE-1 C was greater than in Fig. 1D. (F) Effects of the proteins described in D on the pBLCAT2 reporter plasmid, assayed as in E. Data are graphed as in Fig. 5. (G) Mutations within the PIE-1 C 209–303 subregion (Fig. 5A). (H) Repression of pGAL4–TKCAT by the GAL4(1–147) fusions described in G, assayed as in B. (I) Effects of the proteins described in G on the pBLCAT2 reporter.

References

    1. Andersen B, Weinberg WC, Rennekampff O, McEvilly RJ, Bermingham JR, Jr, Hooshmand F, Vasilyev V, Hansbrough JF, Pittelkow MR, Yuspa SH, Rosenfeld MG. Functions of the POU domain genes Skn-1a/i and Tst-1/Oct-6/SCIP in epidermal differentiation. Genes & Dev. 1997;11:1873–1884. - PubMed
    1. Barabino SMLX, Hübner W, Jenny A, Minivielle-Sebastia L, Keller W. The 30-kD subunit of mammalian cleavage and polyadenylation specificity factor and its yeast homolog are RNA-binding zinc finger proteins. Genes & Dev. 1997;11:1703–1716. - PubMed
    1. Carballo E, Lai WS, Blackshear PJ. Feedback inhibition of macrophage tumor necrosis factor-α production by tristetraprolin. Science. 1998;281:1001–1005. - PubMed
    1. Chen C, Okayama H. High-efficiency transformation of mammalian cells by plasmid DNA. Mol Cell Biol. 1987;7:2745–2752. - PMC - PubMed
    1. Cho EJ, Takagi T, Moore CR, Buratowski S. mRNA capping enzyme is recruited to the transcription complex by phosphorylation of the RNA polymerase II carboxy-terminal domain. Genes & Dev. 1997;11:3319–3326. - PMC - PubMed

Publication types

MeSH terms

Associated data

LinkOut - more resources