. 1999 Feb;113(2):249-66.
doi: 10.1085/jgp.113.2.249.

Reversible Ca gradients between the subplasmalemma and cytosol differentially activate Ca-dependent Cl currents

Affiliations

Reversible Ca gradients between the subplasmalemma and cytosol differentially activate Ca-dependent Cl currents

K Machaca et al. J Gen Physiol. 1999 Feb.

Abstract

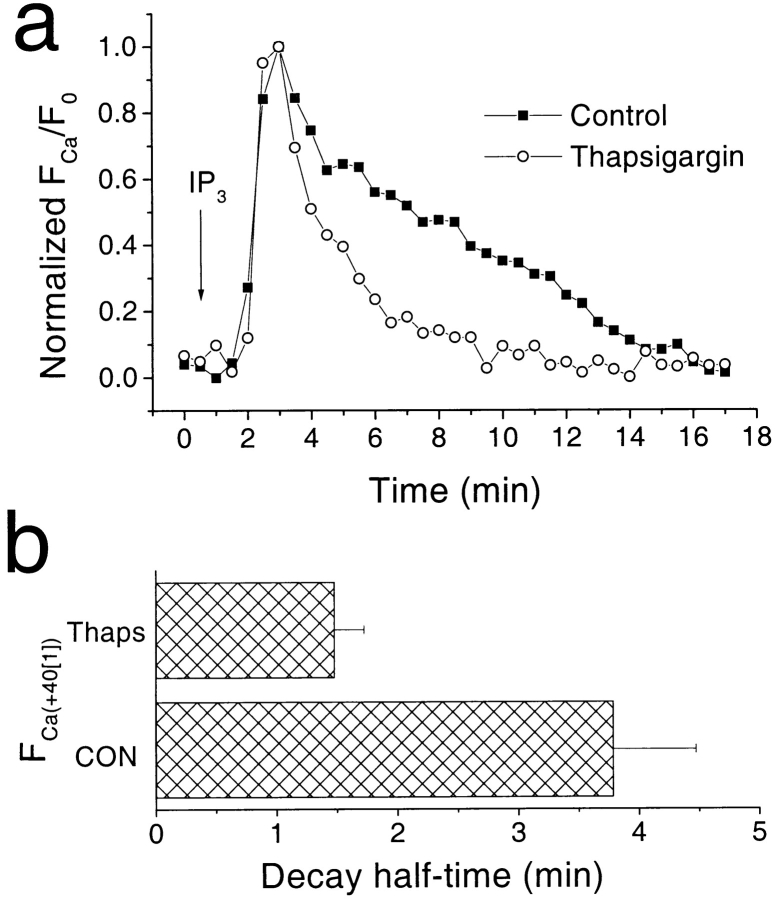
Xenopus oocytes express several different Ca-activated Cl currents that have different waveforms and biophysical properties. We compared the stimulation of Ca-activated Cl currents measured by two-microelectrode voltage clamp with the Ca transients measured in the same cell by confocal microscopy and Ca-sensitive fluorophores. The purpose was to determine how the amplitude and/or spatio-temporal features of the Ca signal might explain how these different Cl currents were activated by Ca. Because Ca release from stores was voltage independent, whereas Ca influx depended upon the electrochemical driving force, we were able to separately assess the contribution of Ca from these two sources. We were surprised to find that Ca signals measured with a cytosolic Ca-sensitive dye, dextran-conjugated Ca-green-1, correlated poorly with Cl currents. This suggested that Cl channels located at the plasma membrane and the Ca-sensitive dye located in the bulk cytosol were sensing different [Ca]. This was true despite Ca measurement in a confocal slice very close to the plasma membrane. In contrast, a membrane-targeted Ca-sensitive dye (Ca-green-C18) reported a Ca signal that correlated much more closely with the Cl currents. We hypothesize that very local, transient, reversible Ca gradients develop between the subplasmalemmal space and the bulk cytosol. [Ca] is higher near the plasma membrane when Ca is provided by Ca influx, whereas the gradient is reversed when Ca is released from stores, because Ca efflux across the plasma membrane is faster than diffusion of Ca from the bulk cytosol to the subplasmalemmal space. Because dissipation of the gradients is accelerated by inhibition of Ca sequestration into the endoplasmic reticulum with thapsigargin, we conclude that [Ca] in the bulk cytosol declines slowly partly due to futile recycling of Ca through the endoplasmic reticulum.


Figures

Figure 1
Figure 1
Experimental setup. (a) Albino Xenopus oocytes were voltage clamped by two electrodes and simultaneously imaged by confocal microscopy using an LSM 410 confocal box (Carl Zeiss, Inc.). A third electrode was used to inject IP3 and release intracellular Ca stores. The hatched box represents the focal section of the oocyte imaged when the pinhole was open to the maximum. (b) Ca-dependent Cl currents. The voltage protocol used in most of the experiments is shown at top. The cell was held at 0 mV and stepped to +40 mV (referred to as +40 mV[1]), −140 and +40 mV again (+40 mV[2]). The currents elicited by this voltage protocol at different time points are shown. Before IP3 injection, the baseline currents are shown. Injection of IP3 releases Ca from internal stores and activates ICl1-S, an outward current that does not inactivate for the duration of the pulse. ICl1-S is measured as the current at the end of the first +40 mV pulse as illustrated in the middle panel. Note that during the Ca release phase ICl1-S is also observed during the second +40-mV pulse. After store depletion, SOCE is activated and Ca influx activates ICl2, an inward current upon hyperpolarization to −140 mV and ICl1-T, a transient outward current detected during the second +40-mV pulse. ICl2 and ICl1-T are measured as the maximum current during the −140-mV and second +40-mV pulse, respectively. ICl1-T is observed only when the +40-mV pulse is preceded by the −140-mV step to induce Ca influx.
Figure 2
Figure 2
Visualization and voltage dependence of store-operated Ca entry. (a) Ca dynamics were imaged by confocal microscopy from a cell injected with Ca-green-1 coupled to 70 kD dextran and voltage clamped. Internal Ca stores were depleted of Ca by injection of 23 nl IP3 (1 mM) (▪ and ○) or by exposure to 14 μM ionomycin (▵). 10 min after IP3 injection, after the wave of Ca release and the development of store-operated Ca entry, the membrane potential was stepped to the indicated voltages from a holding potential of 0 mV (○). The same voltage protocol was repeated after switching the cell to Ca-free solution (▪). The top shows the images of a representative experiment with the voltage indicated below the image. The Nernst equation predicts no influx at +120 mV. Therefore, the image at +120 mV was taken as background fluorescence and was subtracted from the images at the other voltages. In the bottom, total fluorescence at each voltage was measured and normalized to the fluorescence at +120 mV. Fluorescence intensity was plotted (mean ± SEM) as a function of voltage (n = 4) for Ca-free (▪) and Ca-containing (○) solution. (b) Current–voltage relationship for ISOC measured by a ramp voltage pulse from −150 to +100 mV from cells loaded with 5 mM BAPTA to inhibit the Ca-activated Cl currents, and voltage clamped. The mean current ± SEM was plotted as a function of voltage (n = 4).
Figure 3
Figure 3
Voltage-independence of Ca release from stores. The oocyte was loaded with 7.6 μM Ca-Green-1–dextran, and stepped to +40 mV for 1 s, −140 mV for 2 s, and +40 mV again for 1 s from a holding potential of 0 mV at an interepisode interval of 26 s (30 s total per cycle). The cell was bathed in normal Ringer except where indicated by the bar showing Ca-free Ringer. (a) Confocal images collected 600 ms after the beginning of each pulse. Images collected at +40 mV, −140 mV and the difference (Δ) between the two images are shown. The difference (Δ) images are shown as binary images to better illustrate increased Ca levels. (b) IP3 (23 nl, 1 mM) was injected at the arrow. Ca fluorescence during the +40-mV[1] (▪) and −140-mV (○) pulse is plotted vs. time for a typical experiment. IP3 injection stimulated an increase in Ca fluorescence that was independent of voltage. Approximately 8 min later, the cell was switched to Ca-containing Ringer, which produced a voltage-dependent change in the Ca fluorescence. The Ca ionophore, ionomycin (14 μM) was added to completely deplete intracellular Ca stores, as indicated. Ionomycin produced little effect. (c) Voltage-dependent Ca fluorescence as a function of time. Voltage-dependent Ca fluorescence was calculated as the difference between FCa/F0 at −140 mV and +40 mV[1] (⋄, average of four experiments).
Figure 4
Figure 4
Correlation of Ca transients with Cl currents. The oocyte was loaded with 7.6 μM Ca-Green-1–dextran, and stepped to +40 mV for 1 s, −140 mV for 2 s, and +40 mV again for 1 s from a holding potential of 0 mV. The cell was bathed in normal Ringer except where indicated by the bar showing Ca-free Ringer (0 Ca). IP3 (23 nl, 1 mM) was injected at the arrow. (a) Time course of development of Cl currents. The outward current during the first +40-mV pulse (+40 mV[1]) is ICl1-S (▪), the inward current during the −140-mV pulse is ICl2 (○), and the outward current during the second +40-mV pulse (+40 mV[2]) is ICl1-T (▵) (see Fig. 1 for details). (b) Examples of the current traces at the different time points indicated by a–c in a. (c) Ca fluorescence at each voltage during the experiment. The fluorescence was calculated from the entire confocal section and divided by the initial fluorescence before IP3 injection. (d) Normalized ICl1-S and Ca-dependent fluorescence during the +40 mV[1] step to illustrate the temporal relationship. The inset shows the average time required for both ICl1-S and Ca fluorescence at +40 mV[1] to reach one half of their peak value (t 1/2) (n = 7). ICl1-S (t 1/2 = 0.52 ± 0.05) and Ca fluorescence at +40 mV[1] (t 1/2 = 3.78 ± 0.68) had significantly different rates of decay (P < 0.0005). (e) Voltage-dependent Ca fluorescence as a function of time. Voltage-dependent Ca fluorescence was calculated as the difference between FCa/F0 at −140 mV and at +40 mV[1]. (f) Correlation between ICl2, ICl1-T, and voltage-dependent Ca fluorescence. This cell is representative of seven similar experiments with essentially identical results.
Figure 5
Figure 5
Ca transients and Cl currents in normal Ringer. The experimental set up was the same as in Fig. 4 except that the cell was bathed in normal Ringer except where indicated by the bar showing Ca-free Ringer. The point of IP3 injection (23 nl, 1 mM) is indicated by the arrow. (a) Time course of development of the currents at each voltage. (b) Examples of the current traces at different time points indicated by a–c in a. (c) Ca-dependent fluorescence at each voltage during the experiment. (d) Voltage-dependent Ca fluorescence. (e) Correlation between ICl2, ICl1-T, and voltage-dependent Ca fluorescence before switching to Ca-free Ringer. (f) Time required for the currents and Ca fluorescence levels to reach half maximum. For ICl1-S and FCa(+40[1]), the time was calculated from the peak and for ICl2, ICl1-T, and Ca entry from the point of IP3 injection. Decay time for ICl1-S (t 1/2 = 0.72 ± 0.13) and FCa(+40[1]) (t 1/2 = 4.03 ± 0.45) were significantly different (P < 0.00004). The time required for ICl1-T (t 1/2 = 3.12 ± 0.25) and Ca entry (t 1/2 = 3.99 ± 0.56) to reach half maximum value were not significantly different, whereas ICl2 required a significantly (P < 0.0055) longer time to reach half maximal value (t 1/2 = 7.2 ± 0.7) (n = 6).
Figure 6
Figure 6
Fast Ca dynamics imaged with Ca-green–dextran. The experimental setup was identical to Fig. 5 except that images were collected every 100 ms, starting 400 ms before the +40 mV[1] step from a 15 pixel–wide box across the entire oocyte. The oocyte was injected with IP3 > 10 min before the experiment. (a) Ca dynamics measured at a fast time scale (every 100 ms). (b) Correlation of Ca fluorescence (○) with the Cl currents (solid line) measured during the same voltage-clamp episode. The Ca fluorescence is superimposed on the Cl currents. (c) Changes in Ca fluorescence traces during the course of an experiment. In this case, we used a two-step voltage protocol, from 0 to +40 mV for 1.5 s, and then to −140 mV for 1.5 s with an interepisode interval of 15 s. Each trace is the average of five consecutive traces. The x axis shows the start time of the beginning of each average trace, but each trace is 3 s in duration and not to scale of the major x axis. After IP3 injection, Ca-dependent fluorescence increased gradually to reach a maximum ∼2 min later. However, the first two traces after IP3 injection are flat, indicating that there is no significant voltage-dependent Ca entry as Ca is released from the stores. As time progresses, the levels of Ca Green fluorescence at −140 mV, as compared with +40 mV, increase gradually, indicating the development of robust Ca influx.
Figure 7
Figure 7
Effect of inhibition of Ca efflux with La. Normal oocytes were voltage clamped and injected with IP3 (23 nl of 1 mM) at the arrow. The voltage protocol was identical to that in Fig. 4. (a) The cells were bathed either in normal Ringer (○) or normal Ringer plus 1 mM La3+ (▴). The development of ICl1-S (during the +40-mV[1] pulse) is plotted vs. time. (b) Time required for ICl1-S to reach half maximum of the peak current level. The time required to reach half maximum value in normal Ringer (control) (t 1/2 = 0.55 ± 0.08) and in the presence of La3+ (t 1/2 = 3.62 ± 0.49) were significantly different (P < 0.000036).
Figure 8
Figure 8
Fast Ca dynamics imaged with Ca-green–C18. The experimental setup was identical to Fig. 6 except that the cell was injected with Ca-green–C18 instead of Ca-green–dextran, and we imaged from a confocal section 4-μm thick. (a) Ca dynamics measured every 100 ms in an oocyte injected with Ca-green–C18 (○) or Ca-green-dextran (▪ from Fig. 6). (b) Decay half-time for the Ca signal in a. The time required for the fluorescent signal to decay to one-half of the peak amplitude was measured (n = 3). (c) Correlation of the fast Ca dynamics measured by Ca-green– C18 fluorescence with Cl currents. The Ca fluorescence (•) and the Cl currents (solid line) from the same voltage clamp episode are superimposed.
Figure 9
Figure 9
Correlation of Ca-green–C18 fluorescence with decay of ICl1-S. The oocyte was injected with Ca-green–C18 30 min before the start of the experiment. (a) IP3 was injected at t = 0 and Ca fluorescence (○) and ICl1-S (▪) were measured. Because the Cl currents are measured from the entire oocyte, whereas the fluorescence is measured from a very small patch of membrane, the fluorescence trace was shifted ∼2 min on the x axis so that its peak coincided with the peak of ICl1-S to emphasize the similarity in time course. (b) The time for the current and Ca fluorescence to decay to one half of their peak amplitudes were averaged for four experiments as in a. The half time of Ca fluorescence decay for cells injected with Ca-green–dextran is also shown (from Fig. 5 f). (c) The oocyte was injected with Ca-green-1 coupled to 70 kD dextran and imaged with the same pinhole and confocal settings as the cell in a. As in a, the Ca fluorescence trace was shifted by 1 min on the x axis to make the peaks of ICl1-S and Ca fluorescence correspond. IP3 was injected at t = 0. Ca fluorescence (○) decay with a significantly slower time course than ICl1-S (▪) under these conditions, indicating that the correlation between ICl1-S and Ca-green–C18 Ca fluorescence is not due to the conditions used to image submembrane Ca.
Figure 10
Figure 10
Effect of thapsigargin on decay of Ca fluorescence after IP3 injection. The experimental setup was identical to Fig. 5. IP3 was injected at the arrow and Ca fluorescence at +40 mV[1] was measured after IP3 injection (a), and the time required for it to decay to one half of its peak value (t 1/2) was calculated (b) as in Fig. 4 d. Cells were either treated with DMSO (control) or thapsigargin (Thaps) for 1 h to inhibit the SERCAs without completely depleting the stores. The half time of decay of FCa(+40[1]) was significantly different (P < 0.009) between control cells (t 1/2 = 3.78 ± 0.68, n = 7) and thapsigargin-treated cells (t 1/2 = 1.48 ± 0.24, n = 7).
Figure 11
Figure 11
Ca recycling through the ER store. Internal Ca stores were depleted by injecting cells with 46 nl of Ca-green–dextran 333 μM + IP3 50 μM and incubated in nominally Ca-free Ringer for 0.5–2.5 h before the experiment (n = 6). Thapsigargin-treated cells (d–f) were preincubated in 1 μM thapsigargin for 3.5 h before IP3 injection (n = 7) and Heparin-treated cells (g–i) were injected with 92 nl 100 μg/ μl heparin 15 min before the experiment (n = 4). The cells were voltage clamped and stepped to +40 mV for 1.5 s, −140 mV for 2 s, and +40 mV for 1.5 s. a, d, and g represent the time-dependent development of ICl1-S, ICl2, and ICl1-T. b, e, and h show Ca fluorescence at each voltage over time. In b, Ca fluorescence traces at +40 mV[1] and −140 mV from thapsigargin-treated cells (lines, from e) are superimposed on the Ca fluorescence traces under control conditions (symbols) to highlight the difference in slopes. The slopes at +40 mV[1] where significantly (P < 0.047) different between control, thapsigargin, and heparin-treated cells. c, f, and i show Ca entry over time.

Similar articles

Cited by

References

    1. Allbritton NL, Meyer T, Stryer L. Range of messenger action of calcium ion and inositol 1,4,5-trisphosphate. Science. 1992;258:1812–1815. - PubMed
    1. Berg, H.C. 1993. Random Walks in Biology. Princeton University Press, Princeton, NJ. 152 pp.
    1. Berridge MJ. Inositol triphosphate-induced membrane potential oscillations in Xenopusoocytes. J Physiol (Camb) 1988;403:589–599. - PMC - PubMed
    1. Berridge MJ. Elementary and global aspects of calcium signalling. J Physiol (Camb) 1997a;499:291–306. - PMC - PubMed
    1. Berridge MJ. The AM and FM of calcium signalling. Nature. 1997b;386:759–760. - PubMed

Publication types