. 1999 Feb;103(3):365-72.
doi: 10.1172/JCI5479.

The effects of free fatty acids on gluconeogenesis and glycogenolysis in normal subjects

Affiliations

The effects of free fatty acids on gluconeogenesis and glycogenolysis in normal subjects

X Chen et al. J Clin Invest. 1999 Feb.

Abstract

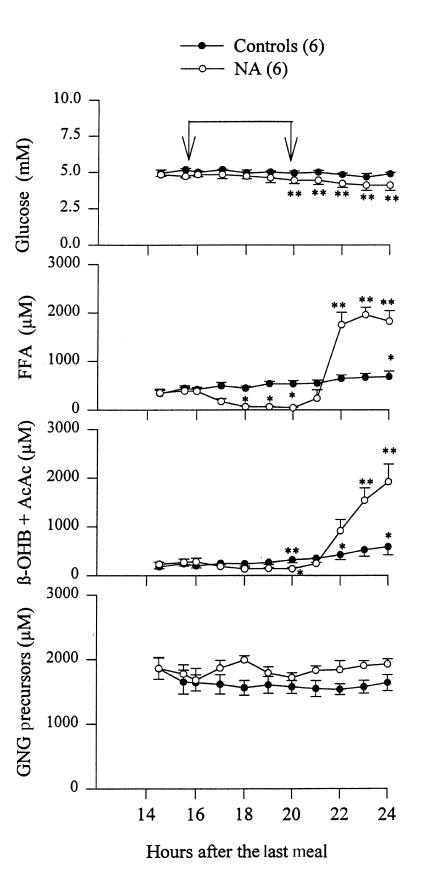
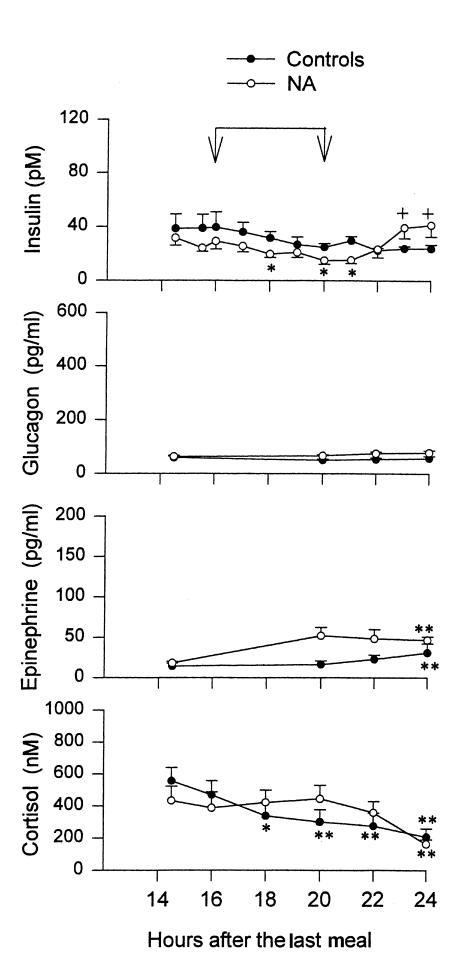
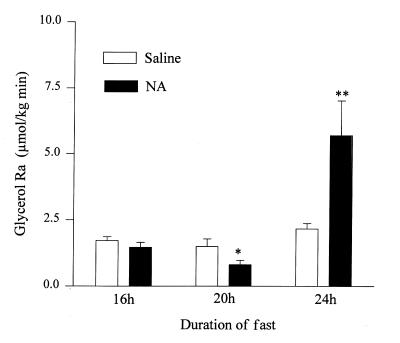
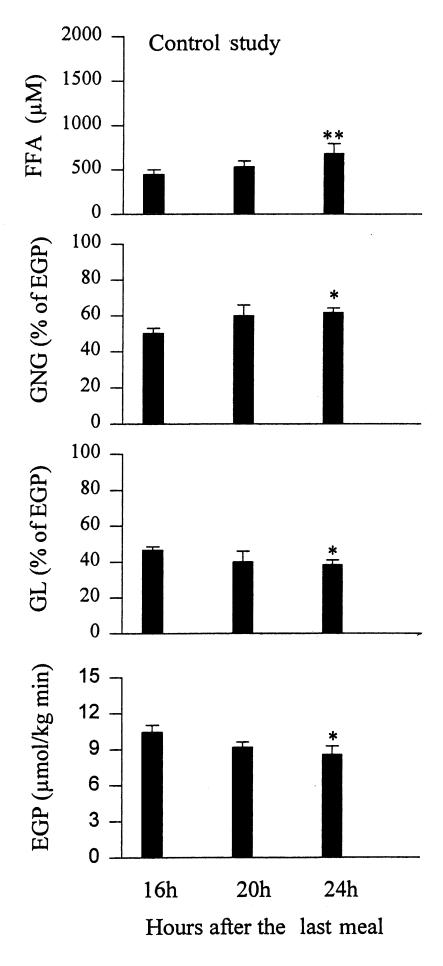
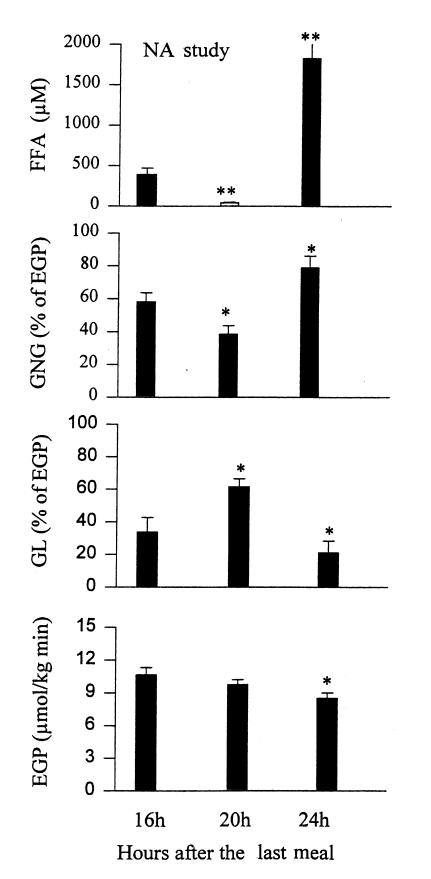
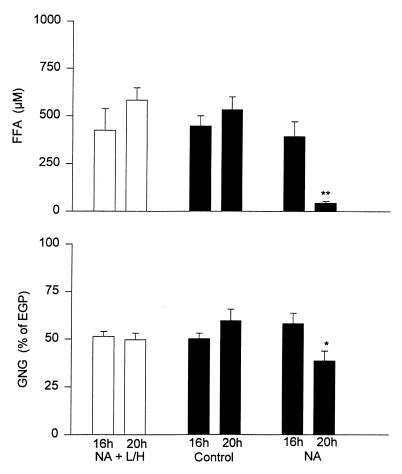
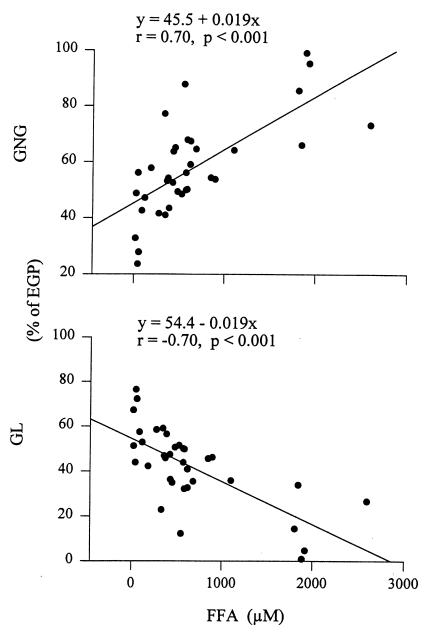
We have quantitatively determined gluconeogenesis (GNG) from all precursors, using a novel method employing 2H20 to address the question of whether changes in plasma free fatty acids (FFA) affect GNG in healthy, nonobese subjects. In the first study (n = 6), plasma FFA were lowered at 16 to 20 hours with nicotinic acid (NA) and were then allowed to rise at 20 to 24 hours (FFA rebound after administration of NA). FFA decreased from 387 microM at 16 hours to 43 microM at 20 hours, and then rebounded to 1,823 microM at 24 hours. GNG decreased from 58.1% at 16 hours to 38.6% of endogenous glucose production at 20 hours (P < 0.005) and then rebounded to 78. 9% at 24 hours (P < 0.05). Conversely, glycogenolysis (GL) increased from 41.9% at 16 hours to 61.4% at 20 hours (P < 0.05), and then decreased to 21.1% at 24 hours (P < 0.05). In the second study (controls; n = 6), volunteers were analyzed between 16 and 24 hours after the last meal. FFA rose from 423 to 681 microM (P < 0.05), and GNG from 50.3% to 61.7% (P < 0.02), whereas GL decreased from 49.7% to 38.3% (P < 0.05). Endogenous glucose production decreased at the same rate in both studies, from 10.7 to 8.6 micromol/kg/min (P < 0. 05). In study 3 (n = 6), in which the NA-mediated decrease of plasma FFA was prevented by infusion of lipid and heparin, neither FFA nor GNG changed significantly. In summary, our data suggest that (a) acute changes in plasma FFA produce acute changes in GNG and reciprocal changes in GL; (b) the decrease in EGP between 16 and 24 hours of fasting is due to a fall in GL; and (c) NA has no direct effect on GNG.


Figures

Figure 1
Figure 1
Plasma concentrations of glucose, free fatty acids (FFA), ketone bodies (β-OHB + AcAc), and gluconeogenesis (GNG) precursors (lactate, alanine, glutamine, glutamate, and glycerol) between 14.5 and 24 h of fasting with (open circles) and without (closed circles) oral administration of NA (100–150 mg every 30 min from 16 to 20 h) in normal subjects. The time of NA administration is indicated by the arrows. Shown are mean ± SEM. *P < 0.05 compared with basal values (14.5 h), **P < 0.01 compared with basal values (14.5 h). AcAc, acetoacetate; β-OHB, β-hydroxybutyrate; NA, nicotinic acid.
Figure 2
Figure 2
Plasma concentrations of insulin, glucagon, epinephrine, and cortisol between 14.5 and 24 h of fasting with (open circles) and without (closed circles) oral administration of NA in normal subjects. Shown are mean ± SEM. Blood samples for glucagon and epinephrine measurements were collected at 14.5, 20, 22, and 24 h only. *P < 0.05 compared with basal values, **P < 0.01 compared with basal values, +P < 0.05 compared with 20 h values.
Figure 3
Figure 3
Rates of lipolysis (Glycerol Ra) 16, 20, and 24 h after the last meal in controls (open bars) and before NA (16 h), after 4 h of NA (20 h), and 4 h after discontinuation of NA (24 h) (shaded bars). *P < 0.05 compared with basal (16 h) values, **P < 0.02 compared with basal (16 h) values.
Figure 4
Figure 4
Plasma free fatty acids (FFA) and rates of gluconeogenesis (GNG), glycogenolysis (GL) (both measured in percent of EGP), and endogenous glucose production (EGP) in controls 16, 20, and 24 h after the last meal. *P < 0.05 compared with basal (16 h) values, **P < 0.02 compared with basal (16 h) values.
Figure 5
Figure 5
Plasma free fatty acids (FFA) and rates of gluconeogenesis (GNG), glycogenolysis (GL) (both measured in percent of EGP), and endogenous glucose production (EGP) in controls before (16 h), after 4 h of NA (20 h), and 4 h after discontinuation of NA (24 h). *P < 0.05 compared with basal (16 h) values, **P < 0.001 compared with basal (16 h) values.
Figure 6
Figure 6
Plasma free fatty acid (FFA) concentrations and gluconeogenesis (GNG) (measured in percent of EGP) before (16 h) and after (20 h) 4 h of NA plus lipid/heparin (NA + L/H), NA, and controls (no NA, no L/H). n = 6 for all three groups. *P < 0.05 comparing 16 h and 20 h values, **P < 0.01 comparing 16 h and 20 h values.
Figure 7
Figure 7
Correlation between plasma free fatty acids (FFA) and gluconeogenesis (GNG) and glycogenolysis (GL). Data from control and NA studies are included.

References

    1. Cahill GF., Jr Starvation in man. N Engl J Med. 1970;282:668–675. - PubMed
    1. Williamsson JF, Kreisberg RA, Felts PW. Mechanisms for the stimulation of gluconeogenesis by fatty acids in perfused rat liver. Proc Natl Acad Sci USA. 1966;6:247–254. - PMC - PubMed
    1. Gonzalez-Manchon C, Ayuso M, Parrilla R. Control of hepatic gluconeo-genesis: role of fatty acid oxidation. Arch Biochem Biophys. 1989;271:1–9. - PubMed
    1. Morand C, Remesy C, Demigne C. Fatty acids are potent modulators of lactate utilization in isolated hepatocytes from fed rats. Am J Physiol. 1993;264:E816–E823. - PubMed
    1. Arinze I, Hanson R. Mitochondrial redox state and the regulation of gluconeo-genesis in the isolated, perfused cat liver. FEBS Lett. 1973;31:280–282. - PubMed

Publication types