

Lipid infusion lowers sympathetic nervous activity and leads to increased beta-cell responsiveness to glucose
- PMID: 9927503
- PMCID: PMC407894
- DOI: 10.1172/JCI3883
Lipid infusion lowers sympathetic nervous activity and leads to increased beta-cell responsiveness to glucose
Abstract
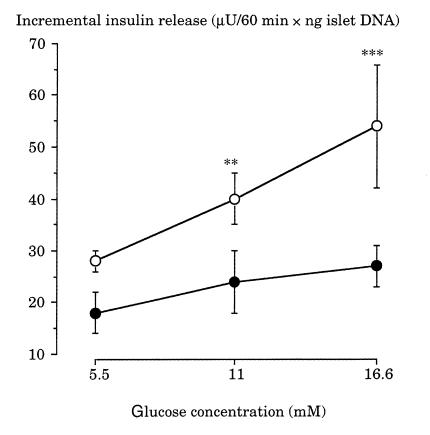
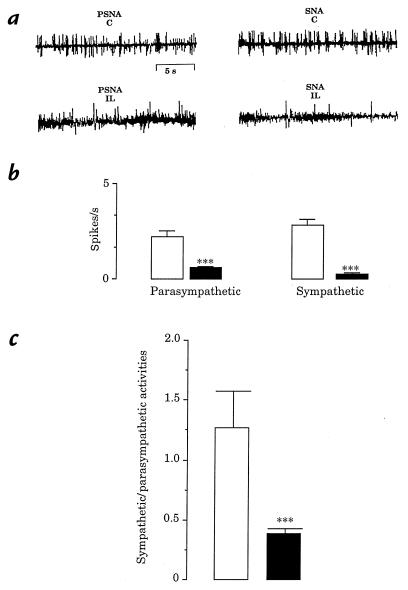
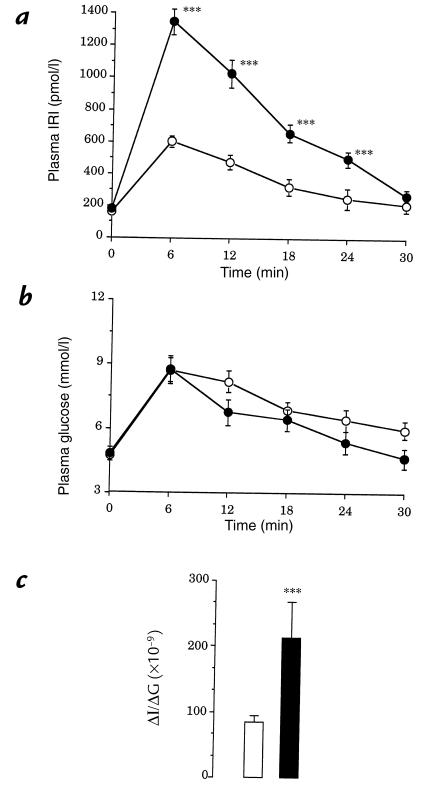
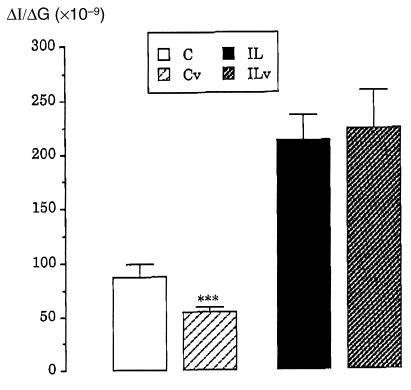
We investigated the possible involvement of the autonomic nervous system in the effect of a long-term elevation of plasma free fatty acid (FFA) concentration on glucose-induced insulin secretion (GIIS) in rats. Rats were infused with an emulsion of triglycerides (Intralipid) for 48 hours (IL rats). This resulted in a twofold increase in plasma FFA concentration. At the end of infusion, GIIS as reflected in the insulinogenic index (DeltaI/DeltaG) was 2.5-fold greater in IL rats compared with control saline-infused rats. The ratio of sympathetic to parasympathetic nervous activities was sharply decreased in IL rats relative to controls. GIIS was studied in the presence of increasing amounts of alpha- and beta-adrenoreceptor agonists and antagonists. The lowest concentrations of the alpha2A-adrenoreceptor agonist oxymetazoline, which were ineffective in control rats, reduced GIIS in IL rats. At the dose of 0.3 pmol/kg, GIIS became similar in IL and control rats. The use of beta-adrenoreceptor agonist (isoproterenol) or antagonist (propranolol) did not result in a significant alteration in GIIS in both groups. GIIS remained as high in IL vagotomized rats as in intact IL rats, indicating that changes in parasympathetic tone were of minor importance. Altogether, the data show that lipid infusion provokes beta-cell hyperresponsiveness in vivo, at least in part through changes in alpha2-adrenergic innervation.
Figures


Similar articles
-
Early changes in insulin secretion and action induced by high-fat diet are related to a decreased sympathetic tone.Am J Physiol Endocrinol Metab. 2005 Jan;288(1):E148-54. doi: 10.1152/ajpendo.00225.2004. Epub 2004 Sep 7. Am J Physiol Endocrinol Metab. 2005. PMID: 15353406
-
Altered activity of the autonomous nervous system as a determinant of the impaired beta-cell secretory response after protein-energy restriction in the rat.Endocrinology. 1998 Aug;139(8):3382-9. doi: 10.1210/endo.139.8.6149. Endocrinology. 1998. PMID: 9681486
-
Beta oxidation in the brain is required for the effects of non-esterified fatty acids on glucose-induced insulin secretion in rats.Diabetologia. 2004 Nov;47(11):2032-8. doi: 10.1007/s00125-004-1569-2. Epub 2004 Nov 30. Diabetologia. 2004. PMID: 15599702
-
[The central nervous system-endocrine pancreas axis].Ann Endocrinol (Paris). 1983;44(4):217-27. Ann Endocrinol (Paris). 1983. PMID: 6142677 Review. French.
-
[Interactions between the central nervous system, the endocrine pancreas and metabolism].Ann Endocrinol (Paris). 1987;48(5):400-6. Ann Endocrinol (Paris). 1987. PMID: 3324925 Review. French.
Cited by
-
GPR40 is necessary but not sufficient for fatty acid stimulation of insulin secretion in vivo.Diabetes. 2007 Apr;56(4):1087-94. doi: 10.2337/db06-1532. Diabetes. 2007. PMID: 17395749 Free PMC article.
-
A Genetic Screen Identifies Hypothalamic Fgf15 as a Regulator of Glucagon Secretion.Cell Rep. 2016 Nov 8;17(7):1795-1806. doi: 10.1016/j.celrep.2016.10.041. Cell Rep. 2016. PMID: 27829151 Free PMC article.
-
Hyperglycaemia but not hyperlipidaemia causes beta cell dysfunction and beta cell loss in the domestic cat.Diabetologia. 2009 Feb;52(2):336-46. doi: 10.1007/s00125-008-1201-y. Epub 2008 Nov 26. Diabetologia. 2009. PMID: 19034421
-
Obese first-degree relatives of patients with type 2 diabetes with elevated triglyceride levels exhibit increased β-cell function.Metab Syndr Relat Disord. 2015 Feb;13(1):45-51. doi: 10.1089/met.2014.0095. Epub 2014 Nov 25. Metab Syndr Relat Disord. 2015. PMID: 25423015 Free PMC article.
-
Elevated circulating free fatty acids levels causing pancreatic islet cell dysfunction through oxidative stress.J Endocrinol Invest. 2010 Jun;33(6):388-94. doi: 10.1007/BF03346609. Epub 2009 Nov 12. J Endocrinol Invest. 2010. PMID: 19915385
References
-
- Reaven G, Lithell H, Landsberg L. Hypertension and associated metabolic abnormalities — the role of insulin resistance and the sympathoadrenal system. N Engl J Med. 1996;334:374–381. - PubMed
-
- Unger R. Lipotoxicity in the pathogenesis of obesity-dependent NIDDM. Genetic and clinical implications. Diabetes. 1995;44:863–870. - PubMed
-
- Sako Y, Grill VA. 48-hour lipid infusion in the rat time-dependently inhibits glucose-induced insulin secretion and B cell oxidation through a process likely coupled to fatty acid oxidation. Endocrinology. 1990;127:1580–1589. - PubMed
-
- Liang X, Buettger C, Berner D, Matchinsky F. Chronic effect of fatty acids on insulin release is not through the alteration of glucose metabolism in a pancreatic beta-cell line (bHC9) Diabetologia. 1997;40:1018–1027. - PubMed
-
- Man Z, et al. Impaired β-cell function and deposition of fat droplets in the pancreas as a consequence of hypertriglyceridemia in OLETF rat, a model of spontaneous NIDDM. Diabetes. 1997;46:1718–1724. - PubMed
