. 1999 Feb 15;19(4):1236-46.
doi: 10.1523/JNEUROSCI.19-04-01236.1999.

Hippocampal long-term potentiation preserves the fidelity of postsynaptic responses to presynaptic bursts

Affiliations

Hippocampal long-term potentiation preserves the fidelity of postsynaptic responses to presynaptic bursts

D K Selig et al. J Neurosci. .

Abstract

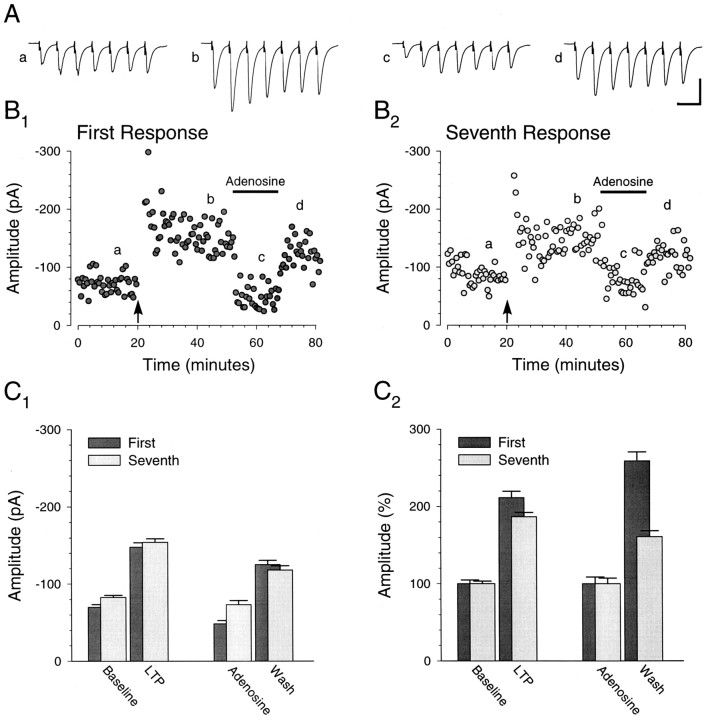
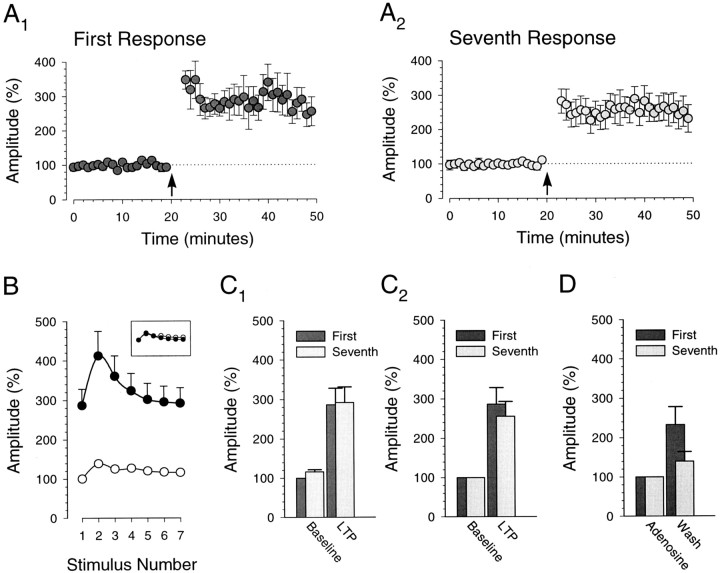
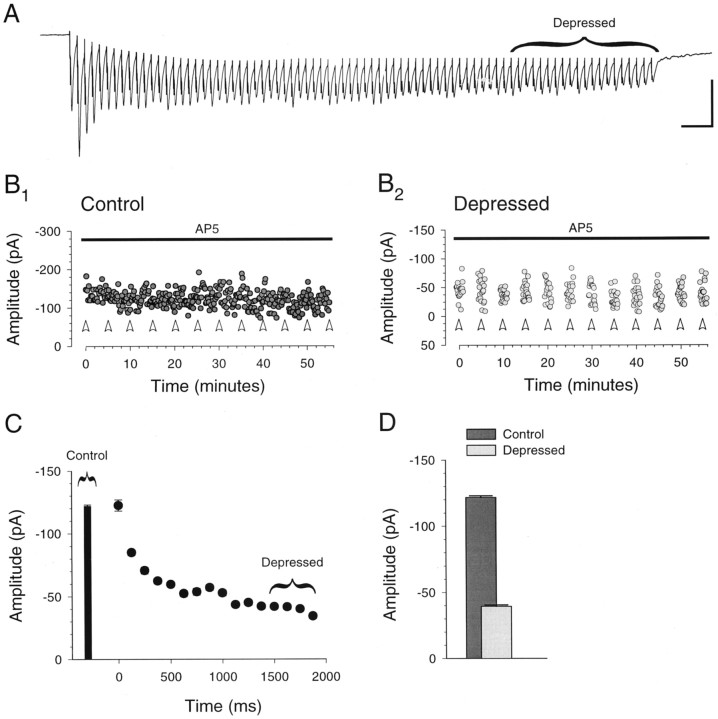
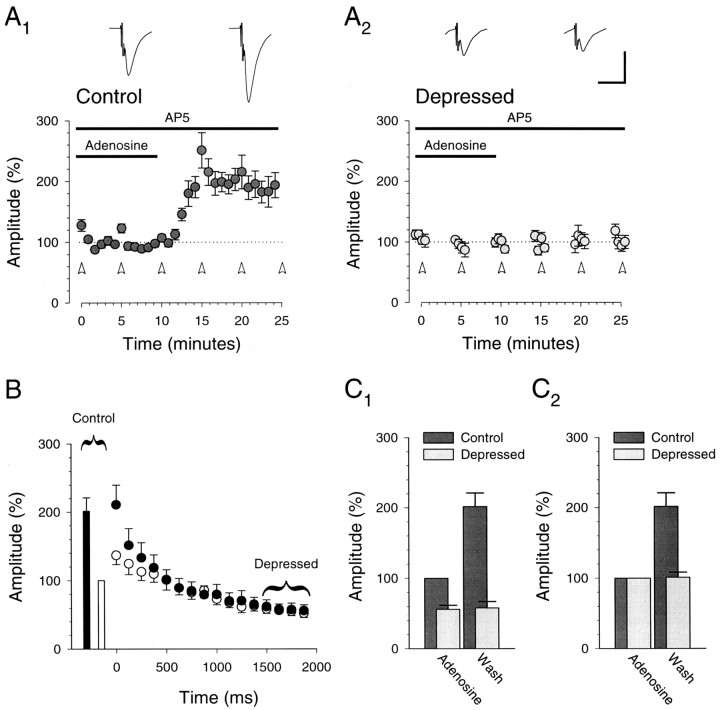
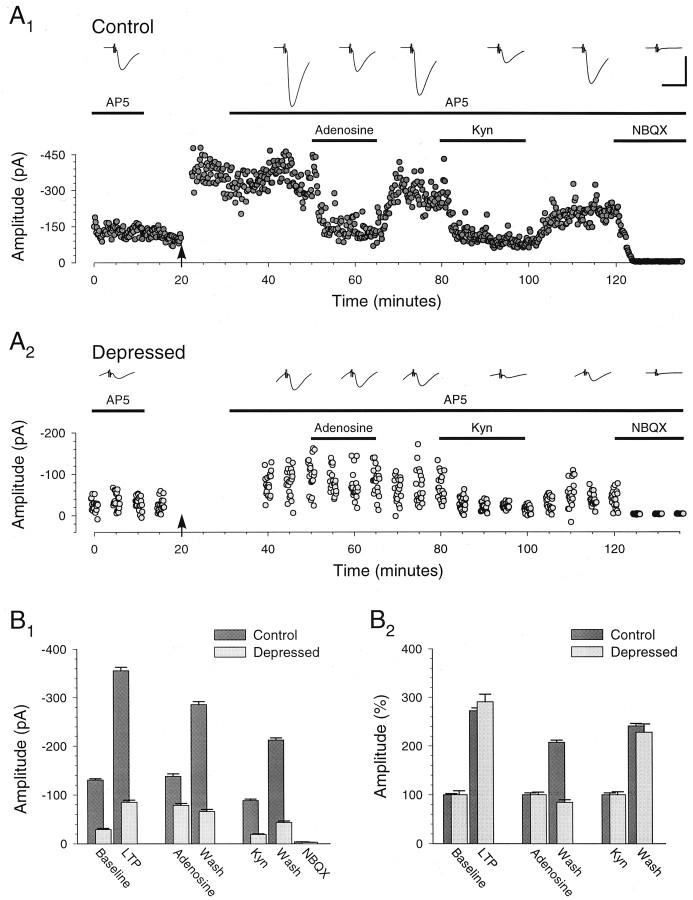
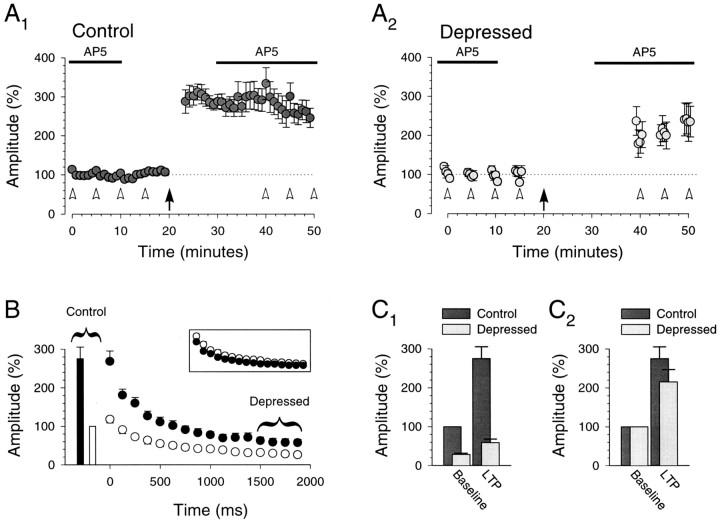
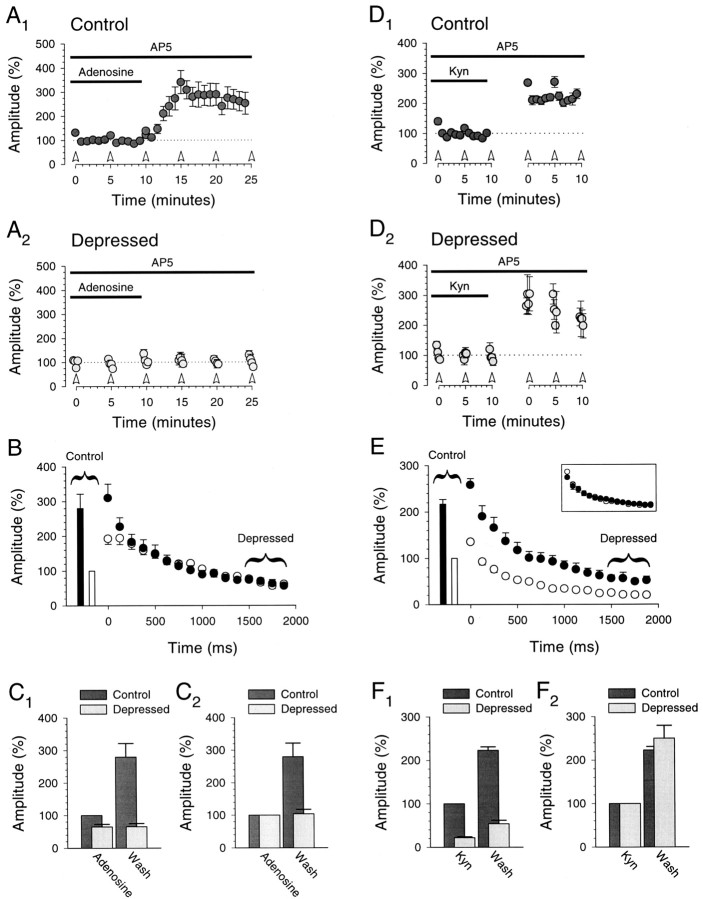
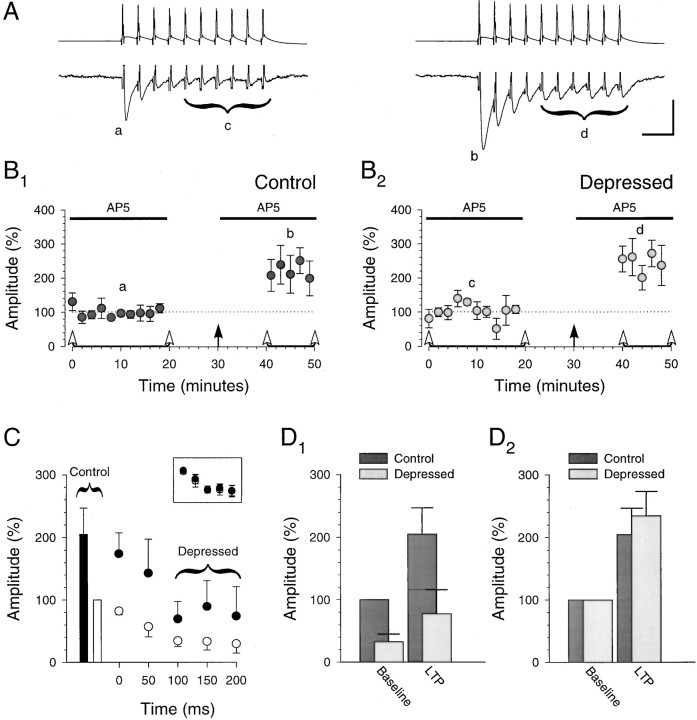
Hippocampal cells often fire prolonged bursts of action potentials, resulting in dynamic modulation of postsynaptic responses; yet long-term potentiation (LTP) has routinely been studied using only single presynaptic stimuli given at low frequency. Recent work on neocortical synapses has suggested that LTP may cause a "redistribution of synaptic strength" in which synaptic responses to the first stimulus of a presynaptic burst of action potentials are potentiated with later responses depressed. We have examined whether this redistribution occurs at hippocampal synapses during LTP. Using prolonged bursts that result in maximal short-term depression of later responses within the burst, we found that LTP resulted in a uniform potentiation of individual responses throughout the burst rather than a redistribution of synaptic strength. This occurred both at Schaffer collateral-CA1 synapses and at CA3-CA3 synapses, the latter being activated and monitored using paired recordings. Thus in the hippocampus, LTP preserves the fidelity of postsynaptic responses to presynaptic bursts by a uniform increase rather than a redistribution of synaptic strength, a finding that suggests there are important differences between neocortex and hippocampus in how long-term changes in synaptic strength are used to encode new information.


Figures

Fig. 1.
Fig. 1.
Example of synaptic response to short presynaptic bursts after LTP. A, Averages of 20 consecutive traces in response to short-burst stimulation (25 Hz; 7 stimuli) at the times indicted by theletters a–d in B. Calibration: 100 pA, 50 msec. B, Typical experiment in which pairing presynaptic stimulation with postsynaptic depolarization (filled arrow) results in a stable increase in the amplitude of the response to the first (B1) as well as the seventh (B2) stimulus in the burst. Adenosine (1 μm) was perfused during the time indicated by thehorizontal bar. After wash, the amplitude of both the first and seventh response was augmented. C, Average amplitudes of the first and seventh responses immediately before pairing (Baseline), 20 min after pairing (LTP), during adenosine (Adenosine), and immediately after wash of adenosine (Wash). Absolute response amplitudes (C1) and the first and seventh response amplitudes normalized to their respective baseline amplitudes (C2) are shown. All values are represented as the mean ± SEM. Allpanels illustrate data from the same cell.
Fig. 2.
Fig. 2.
Fidelity of the synaptic response to short presynaptic bursts is preserved after LTP.A, Summary graph (n = 5) showing that the amplitude of the response to the first (A1) and seventh (A2) stimulus in the short presynaptic bursts (25 Hz; 7 stimuli) undergoes a similar, stable potentiation with pairing (filled arrow).B, Average response amplitude to each stimulus before (○) and after (•) pairing normalized to the amplitude of the first response before pairing. Inset, The same data but with the amplitudes of all responses after pairing normalized to the average amplitude of the first response after pairing. C, Average amplitude of first and seventh response immediately before pairing (Baseline) and 20 min after pairing (LTP). Amplitudes are normalized to the amplitude of the first response during the baseline (C1). The first and seventh response amplitudes are normalized separately to their respective baseline amplitudes (C2). Potentiation of the first and seventh response amplitudes was not significantly different (286 ± 42 and 256 ± 38%, respectively;n = 5; p > 0.05, pairedt test). D, The same experiments with adenosine (1–2 μm) applied after pairing. After wash, there was an increase in the amplitude of both the first and seventh responses (n = 4). All panelsillustrate data from the same set of cells (n = 5).
Fig. 3.
Fig. 3.
Prolonged presynaptic bursts of stimuli are necessary to depress the synaptic response. A, Example of the response to a prolonged presynaptic burst (40 Hz; 80 stimuli). The trace shows the average of 12 consecutive burst responses given every 5 min in the presence of 50 μmd-AP-5. Calibration: 100 pA, 100 msec. B, The amplitudes of the control (B1) and depressed (B2) responses, showing that these amplitudes were stable over time. Control responses (B1) consist of responses to single stimuli (every 10 sec) as well as the first response in each burst. Depressed responses (B2) are the last 20 responses in each burst, as shown in A. Bursts were given at the times indicated by the open arrowheads. Note the different amplitude scales in B1and B2. C, Average amplitude of the control response as well as the average amplitude of each group of five successive responses (125 msec) in the 12 bursts.D, Average control and depressed response amplitudes. All panels illustrate data from the same cell.
Fig. 4.
Fig. 4.
Depressed synaptic responses are unaffected by adenosine. A, Depressed synaptic responses are unaffected by adenosine, a presynaptic neuromodulator, suggesting that under these conditions the burst is maximally depressing (n = 10). Control responses (A1) increase after washing adenosine (1–2 μm), but depressed responses (A2; last 20 responses in burst) remain unchanged. Traces are averages of 60 responses (10 min) and are centered over the time when the averages were taken. Open arrowheads designate bursts (40 Hz; 80 stimuli). B, Control responses (bars, ■ and ▪) and responses to the burst (circles, ○ and •) during adenosine (open symbols, ■ and ○) and after washing (closed symbols, ▪ and •) are shown. The effect of adenosine was evident only in the responses to the first 10–20 stimuli in the burst (each point represents the responses to five stimuli in the burst).C, Averages (10 min) of control and depressed responses in adenosine and after wash are shown. Amplitudes are normalized to the control response amplitude in adenosine (C1) and to the average amplitudes in adenosine (C2). Allpanels illustrate data from the same set of cells (n = 10).
Fig. 5.
Fig. 5.
Example of the synaptic response to prolonged bursts after LTP, adenosine, and kynurenic acid.A, Typical experiment in which the induction ofLTP with pairing (filled arrow) results in a stable potentiation of the control responses (A1) as well as the depressed responses elicited by the prolonged presynaptic bursts (A2; 40 Hz; 80 stimuli). Adenosine (2 μm), kynurenic acid (Kyn; 250 μm), and NBQX (5 μm) were perfused during the times indicated by the horizontal bars. Adenosine depressed the control responses without affecting the depressed responses. Kynurenic acid depressed both responses. Traces are averages of 60 responses and arecentered over the time when the averages were taken. Calibration: A1,A2, 200 pA, 20 msec. Note, however, the different amplitude scales in A1 andA2. B, Averages of control and depressed response amplitudes with LTP, adenosine, kynurenic acid, and NBQX. Absolute amplitudes are summarized (B1). Control and depressed response amplitudes are normalized to their respective amplitudes during the baseline, in adenosine, and in kynurenic acid (B2). All panelsillustrate data from the same cell.
Fig. 6.
Fig. 6.
Fidelity of the synaptic response to prolonged bursts is preserved after LTP.A, Summary graph (n = 8) showing that the control responses (A1) and the depressed responses (A2) undergo a similar, stable potentiation after the induction ofLTP with pairing (filled arrow). Bursts were given at the times indicated by the open arrowheads (40 Hz; 80 stimuli). B, Control responses (bars, ■ and ▪) and responses to burst (circles, ○ and •]) during the baseline (open symbols, ■ and ○) and after pairing (closed symbols, ▪ and •). Inset, The same data but with the amplitudes of all responses after pairing normalized to the average amplitude of the control response after pairing (each point represents the responses to five stimuli in the burst). It is evident that the potentiation during LTPwas uniform for responses to all stimuli of the burst, thus maintaining fidelity of the synaptic burst response. C, Averages of control and depressed response amplitudes during the baseline and afterLTP. Amplitudes are normalized to the control response amplitude during the baseline (C1). Control and depressed response amplitudes (C2) are normalized to their respective ampli-tudes during the baseline and are not significantly different after LTP (275 ± 30 and 215 ± 32%, respectively; n = 8;p > 0.05, paired t test). Allpanels illustrate data from the same set of cells (n = 8).
Fig. 7.
Fig. 7.
Synaptic responses to prolonged bursts are altered by adenosine but not by kynurenic acid. A, After LTP, control responses (A1) increase after washing adenosine (1–2 μm), but depressed responses (A2; last 20 responses in burst) are unaffected (n = 6). Open arrowheadsdesignate bursts (40 Hz; 80 stimuli). B, Control responses (bars, ■ and ▪) and responses to burst (circles, ○ and •) during adenosine (open symbols, ■ and ○) and after washing (closed symbols, ▪ and •) are shown. Each point represents the responses to five stimuli. C, Averages of control and depressed response amplitudes in adenosine and after wash are shown. Amplitudes are normalized to the control response amplitude in adenosine (C1) and to the average amplitudes in adenosine (C2).D, After LTP, both control (D1) and depressed responses (D2; last 20 responses in burst) increase after washing kynurenic acid (Kyn; 250 μm; n = 6). Open arrowheads designate bursts (40 Hz; 80 stimuli). Thebreak in the graphs represents 5–10 min.E, Control responses (bars, ■ and ▪) and responses to burst (circles, ○ and •) during kynurenic acid (open symbols, ■ and ○) and after washing (closed symbols, ▪ and •) are shown.Inset, The same data are shown but with the amplitudes of all responses after washing normalized to the average amplitude of the control response after washing (each point represents the responses to five stimuli in the burst). It is evident that the responses to bursts underwent a uniform increase in gain. F, Averages of control and depressed response amplitudes in kynurenic acid and after wash. Amplitudes are normalized to the control response amplitude in kynurenic acid (F1) and to the average amplitudes in kynurenic acid (F2). All panelsillustrate data after LTP from the same cells (n = 6), a subset of those shown in Figure 6.
Fig. 8.
Fig. 8.
Fidelity of the synaptic response to presynaptic bursts is preserved after LTP when recording from pairs of CA3 pyramidal cells. A, Individual example showing averages of 40 consecutive unitary responses (lower traces) to presynaptic bursts (upper traces; 40 Hz; 10 stimuli) given at the times indicted by the letters a–d in B. Calibration: 100 mV, 10 pA, 50 msec. B, Summary graph (n = 4) showing that the unitary control responses (B1) and the unitary depressed responses (B2; last six responses in burst) undergo a similar, stable potentiation after induction ofLTP with pairing (filled arrow). Bursts were induced in the presynaptic cell every 30 sec at the times indicated by the open arrowheads. C, Unitary control responses (bars, ■ and ▪) and unitary responses to burst (circles, ○ and •) during the baseline (open symbols, ■ and ○) and after pairing (closed symbols, ▪ and •).Inset, The same data but with the amplitudes of all responses after pairing normalized to the average amplitude of the control response after pairing (each point represents the responses to two stimuli in the burst). It is evident that the unitary responses to bursts underwent a uniform potentiation, thus maintaining fidelity to the original synaptic response. D, Averages of unitary control and unitary depressed response amplitudes during the baseline and after LTP. Amplitudes are normalized to the control response amplitude during the baseline (D1). Control and depressed response amplitudes are normalized to their respective amplitudes during the baseline (D2). They underwent a similar degree of potentiation (205 ± 42 and 234 ± 39%, respectively; n = 4). B–D, Data from the same set of connected CA3 cell pairs (n = 4), including the pair whose responses are illustrated in A.

Similar articles

Cited by

References

    1. Abbott LF, Varela JA, Sen K, Nelson SB. Synaptic depression and cortical gain control. Science. 1997;275:220–224. - PubMed
    1. Allen C, Stevens CF. An evaluation of causes for unreliability of synaptic transmission. Proc Natl Acad Sci USA. 1994;91:10380–10383. - PMC - PubMed
    1. Asztely F, Xiao MY, Gustafsson B. Long-term potentiation and paired-pulse facilitation in the hippocampal CA1 region. NeuroReport. 1996;7:1609–1612. - PubMed
    1. Bliss TV, Collingridge GL. A synaptic model of memory: long-term potentiation in the hippocampus. Nature. 1993;361:31–39. - PubMed
    1. Brenowitz S, David J, Trussell L. Enhancement of synaptic efficacy by presynaptic GABA(B) receptors. Neuron. 1998;20:135–141. - PubMed

Publication types

LinkOut - more resources