. 1999 Feb 15;19(4):1294-306.
doi: 10.1523/JNEUROSCI.19-04-01294.1999.

Sustained and accelerating activity at two discrete sites generate epileptiform discharges in slices of piriform cortex

Affiliations

Sustained and accelerating activity at two discrete sites generate epileptiform discharges in slices of piriform cortex

R Demir et al. J Neurosci. .

Abstract

When near-threshold electrical stimulation is used to evoke epileptiform discharges in brain slices, a latent period of up to 150 msec elapses before the discharge begins. During this period most neurons are silent, and abnormal electrical activity is difficult to detect with microelectrodes. A fundamental question about epileptiform activity concerns how synchronous discharges arise abruptly in a relatively quiescent slice. This issue was addressed here by using voltage imaging techniques to study epileptiform discharges in rat piriform cortex slices. These experiments revealed two distinct forms of electrical activity during the latent period. (1) A steeply increasing depolarization, referred to here as onset activity, has been described previously and occurs at the site of discharge onset. (2) A sustained depolarization that precedes onset activity, referred to here as plateau activity, has not been described previously. Plateau and onset activity occurred in different subregions of the endopiriform nucleus (a region of high seizure susceptibility). When cobalt or kynurenic acid was applied focally to inhibit electrical activity at the site of plateau activity, discharges were blocked. However, application of these agents to other nearby sites (except the site of onset) failed to block discharges. Plateau activity represents a novel form of electrical activity that precedes and is necessary for epileptiform discharges. Discharges thus are generated in a sequential process by two spatially distinct neuronal circuits. The first circuit amplifies and sustains activity initiated by the stimulus, and the second generates the actual discharge in response to an excitatory drive from the first.


Figures

Fig. 1.
Fig. 1.
Sketch of a piriform cortex (PC) slice. Roman numerals indicate the layers of PC.En, Endopiriform nucleus; ec, external capsule; AI, agranular insula;PRha, anterior perirhinal cortex;RF, rhinal fissure; CPu, caudate putamen;Cl, claustrum.
Fig. 2.
Fig. 2.
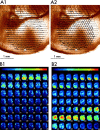
Spread of electrical activity in PC slices.A, Overlays of fluorescence traces on video images show the spread of electrical activity (later figures show expanded views of selected traces). A1, In a control slice responses were largest near the stimulus electrode (stimulus at 100 μA, 200 μsec).A2, In a disinhibited slice (with 10 μmbicuculline methiodide) a weaker stimulus (30 μA, 200 μsec) evoked epileptiform activity that was evident through most of the slice. Stimulation sites in layer Ib are indicated by arrows. Trace durations are 450 msec, with the stimulus applied 28 msec after the start of the trace. B, Sequences of intensity-coded color maps show the temporal pattern of spread for the overlays inA. The code for fluorescence intensity is indicated by the scale bar at the top (increasing depolarization frompurple to red). Sequentially numbered frames represent time points at 5.7 msec intervals. B1, A control slice shows a local response immediately after the stimulus (red spot in frame 3), which decays to the prestimulus background level by frame 12.B2, In a disinhibited slice, the local response displays an approximately similar time course. An epileptiform discharge began in the dorsal-most portion of the En in frame 30. The discharge intensified and spread through the overlying PC and neighboring neocortex in subsequent frames. During the latent period a persistent light blue spot in the middle offrames 12–28 (indicated by a white arrowin frame 20) shows activity not evident in the prestimulus frames. This represents plateau activity displayed more clearly in subsequent figures. Note that the later frames inB1 (after frame 15) are darker thanframes 1 and 2 preceding the stimulus. This reflects slow inhibition after the rapid excitatory response.
Fig. 3.
Fig. 3.
Voltage-sensitive dye fluorescence at selected locations during an epileptiform discharge. A, A Nissl-stained slice was prepared after the imaging experiment to identify anatomical structures (labels as in Fig. 1). Thearrowhead marks the border between PC and adjacent neocortex. B, A video image of the same slice taken during recordings shows the site of onset of an epileptiform discharge (pink) and the site of plateau activity (blue). Epileptiform discharges were evoked by a 132 μA, 200 μsec stimulus, with the electrode visible in layer Ib.C, Fluorescence traces from the indicated sites.Trace 1 was taken from the central part of the En in which activity started abruptly after onset activity and plateau activity at other sites. Trace 2 was taken from the site of onset in dorsal-most En and shows ramp-like onset activity leading to an epileptiform discharge. A comparison of latencies at the different sites with the aid of the dashed line shows that the discharge appeared at this location first. Trace 3 shows plateau activity (indicated by a starred bracket). Trace 4 from a site in layer III outside the plateau activity region shows that the local response decayed before the discharge began. The arrow indicates the time of stimulus. The top inset in Cshows traces 1 and 2 superimposed to emphasize the ramp-like character of onset activity. This contrasts with the abrupt emergence of the discharge at a longer latency at a nearby location. The bottom inset shows traces 2 and 3 superimposed to illustrate that plateau activity precedes the ramp-like build-up at the site of onset by 10–20 msec. This superposition also highlights the differing time courses of plateau activity and onset activity.
Fig. 4.
Fig. 4.
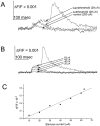
Responses at the site of plateau activity.A, Fluorescence signals were taken from a location near the border between the En and layer III at a location within the region shaded blue in Figure 3B. Before the addition of bicuculline methiodide to the bath, a 200 μA, 200 μsec stimulus applied in layer Ib (site is similar to that shown in Fig.2B) evoked a small, rapidly decaying control response (bottom trace). After bath application of 5 μm bicuculline methiodide, a threshold stimulus current (29 μA) was used to evoke subthreshold and suprathreshold epileptiform responses with equal probability. In suprathreshold responses the plateau activity had a slightly higher level than the peak of the subthreshold response. B, A series of subthreshold responses to stimuli of increasing strengths is shown at the site of plateau activity in an induced slice. C, A plot of response versus stimulus strength at the site of plateau activity shows graded responses to increasing stimulus current. Responses plotted are to subthreshold stimulus currents, except thefinal point, which gives the amplitude of plateau activity in a suprathreshold response. This plot was made from the same series of responses used in B. Two other plots were examined and showed similar behavior.
Fig. 5.
Fig. 5.
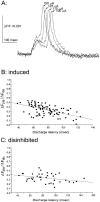
A, Superimposed traces from the site of plateau activity for four suprathreshold stimuli. Increasing the stimulus strength produced a decrease in discharge latency concomitant with an increase in the amplitude of plateau activity. B, C, The peak change in fluorescence associated with the plateau event (ΔFpla) was normalized to the peak fluorescence change of the epileptiform discharge (ΔFdis) and plotted versus discharge latency. Each individual trace gave one point for this plot, but because stimuli of different strengths could be used on one slice, many points could be obtained per experiment. B, Data were pooled from eight induced slices. C, Data were pooled from seven disinhibited slices. The stimulus strength was varied to obtain the range of latencies plotted. Linear regression showed a statistically significant correlation with r = −0.57 (p < 10−8) inB and r = −0.35 (p < 0.05) in C.
Fig. 6.
Fig. 6.
Variations in size of sites of onset and plateau activity with increasing stimulus current. Traces are taken from the regions shown. As in Figure 3, the site of onset is shadedpink (traces A1,B1, andC1) and the site of plateau activity is shaded blue (tracesA2,B2, andC2). A, With a stimulus current at the threshold for epileptiform discharge generation (100 μA), the sizes of both onset and plateau regions were smallest. Increasing stimulus current to 115 μA (B) and 125 μA (C) increased the sizes of both regions. The traces show a shortening of the latent period and an increase in amplitude of plateau activity as the stimulus current was increased (see Figs. 4, 5). The site of stimulus is marked by the double wavy lines. Vertical dashed lines show that the discharge appeared at the site of onset first.
Fig. 7.
Fig. 7.
Plot of plateau activity amplitude versus distance. The amplitude of plateau activity was determined by measuring fluorescence from individual detectors along a line starting from the center of the blue-shaded plateau activity contour of Figure 6A and extending in the ventral direction (to the right in the video image). This line follows the ventrally directed (rightward) increase in size of the plateau region shown in Figure 6. The stimulus currents were 100 μA (filled squares) and 125 μA (filled circles). These plots were made from the same experiment used to make Figure 6. Plots from two other experiments showed similar behavior. Sigmoidal curves were drawn to highlight the uniform amplitude within the region of plateau activity.
Fig. 8.
Fig. 8.
Blockade of epileptiform discharges in an induced slice by CoCl2. A solution of 10 mmCoCl2 was applied to the locations indicated by theletters in the video image above the traces. Fluorescence traces are displayed from each of these sites. CoCl2 was applied to the site of plateau activity (blue, A), the site of discharge onset (pink, B), the central portion of the En outside of the sites of onset and plateau activity (C), and the adjacent neocortex (D). The top traces (1) in each part show epileptiform discharges before CoCl2 application, and the second traces (2) show responses immediately after. InA and B the discharge was blocked, but not in C and D, when the same quantity of CoCl2 was applied to each site. The third traces (3) of A and B show recovery 2 or 3 min after CoCl2 application. Stimulus currents: A, 375 μA; B, 300 μA;C, 200 μA; D, 300 μA.Arrows mark the time of electrical stimulation.
Fig. 9.
Fig. 9.
Fluorescence traces from the site of plateau activity. Traces were taken from the same experiment as Figure 8, with CoCl2 applied to each of the different sites indicated in the video image of Figure 8 (a, before CoCl2application; b, immediately after). A, CoCl2 at the site of plateau activity reduced the amplitude of the depolarization at that site and blocked the epileptiform discharge. B, CoCl2 at the site of onset blocked the epileptiform discharge but had little effect on the amplitude of the signal at the site of plateau activity.C, D, CoCl2 at two other sites had no effect on the level of plateau activity and did not block the epileptiform discharge.
Fig. 10.
Fig. 10.
Control experiments for spread of CoCl2 and kynurenic acid. Signals at small distances from sites of CoCl2 and kynurenic acid application show no direct effects of these reagents. These agents were each applied to the site of plateau activity, where they reduced the amplitude of the signal locally and blocked the epileptiform discharge (a, before drug application; b, immediately after). A, A trace 500 μm away from the site of CoCl2 application shows that the amplitude of a signal within the plateau region was not reduced. B, A trace 375 μm from the site of kynurenic acid application shows that the local response to stimulus outside the plateau region was not reduced. The CoCl2 data were taken from the experiment used to make Figure 8, and the kynurenic acid data were taken from the experiment used to make Figure 11.
Fig. 11.
Fig. 11.
Blockade of epileptiform activity by kynurenic acid. Local application of 5 mm kynurenic acid tested the role of excitatory synaptic transmission at various locations.A–D refer to approximately the same sites indicated in Figure 8. Thus, kynurenic acid blocked discharges when applied to the site of plateau activity (A) and the site of discharge onset (B), but injection of the same quantity of kynurenic acid failed to block discharges when applied to another site in the En (C) or to the neighboring neocortex (D). The top traces (1) indicate discharges before kynurenic acid application, and the second traces (2) show responses to the same electrical stimulus immediately after. InA and B a third trace (3) shows recovery 2 min after kynurenic acid application. In each panel the traces are shown at the site of kynurenic acid application. Arrows mark the time of electrical stimulation. All insets show fluorescence traces from the site of plateau activity (site A in Fig.8), with kynurenic acid applied to the sites indicated by the lettersA–D in Figure 8 (a, before drug application; b, immediately after). Stimulus currents:A, 250 μA; B, 175 μA;C, 200 μA; D, 175 μA.
Fig. 12.
Fig. 12.
A minimal circuit diagram that is based on known features of PC anatomy provides a guide to the discussion of plateau activity. The structures and labels are as in Figure 1. Deep multipolar cells (windmills) concentrated in the En are connected reciprocally with layer II pyramidal cells (triangles). A suprathreshold stimulus anywhere in the PC or En activates a cluster of multipolar cells at the border of the En with deep layer III (light gray). These multipolar cells sustain plateau activity, with the aid of reciprocal excitation within this population, and project to other multipolar cells (a) at the site of discharge onset (dark gray). Excitatory feedback from the site of onset to the site of plateau activity (b) may contribute to sustaining plateau activity. As plateau activity continues, onset activity accelerates. The excitatory drive from the site of plateau activity to the site of onset also may be amplified by local reciprocal excitation (between the dark gray cells) to produce ramp-like onset activity, culminating in an epileptiform discharge.

Similar articles

Cited by

References

    1. Ayala GF, Dichter M, Gumnit RJ, Matsumoto H, Spencer WA. Genesis of epileptic interictal spikes. New knowledge of cortical feedback systems suggests a neurophysiological explanation of brief paroxysms. Brain Res. 1973;52:1–17. - PubMed
    1. Banks MI, Haberly LB, Jackson MB. Layer-specific properties of the transient K-current (Ia) in piriform cortex. J Neurosci. 1996;16:3862–3876. - PMC - PubMed
    1. Behan M, Haberly LB (1999) Intrinsic and efferent connections of the endopiriform nucleus in rat. J Comp Neurol, in press. - PubMed
    1. Behan M, Sachdev P, Haberly LB. Intrinsic and efferent connections of the endopiriform nucleus that may contribute to epileptogenesis. Soc Neurosci Abstr. 1997;23:317.8.
    1. Burwell RD, Witter MP, Amaral DG. The perirhinal and postrhinal cortices of the rat: a review of the neuroanatomical literature and comparison with findings from the monkey brain. Hippocampus. 1995;5:390–408. - PubMed

Publication types