

The organization of cerebellar and basal ganglia outputs to primary motor cortex as revealed by retrograde transneuronal transport of herpes simplex virus type 1
- PMID: 9952421
- PMCID: PMC6786031
- DOI: 10.1523/JNEUROSCI.19-04-01446.1999
The organization of cerebellar and basal ganglia outputs to primary motor cortex as revealed by retrograde transneuronal transport of herpes simplex virus type 1
Abstract
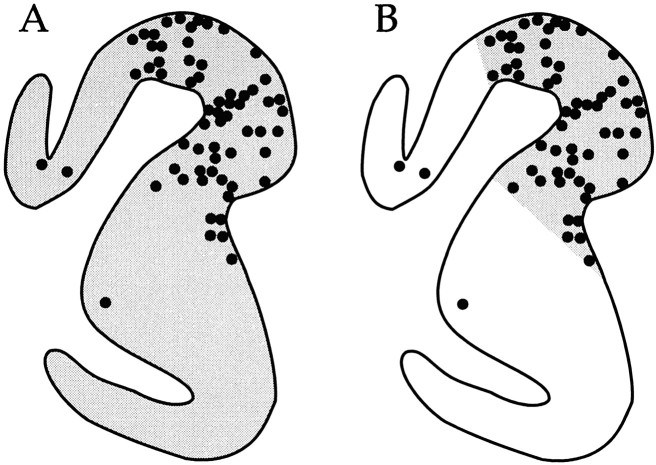
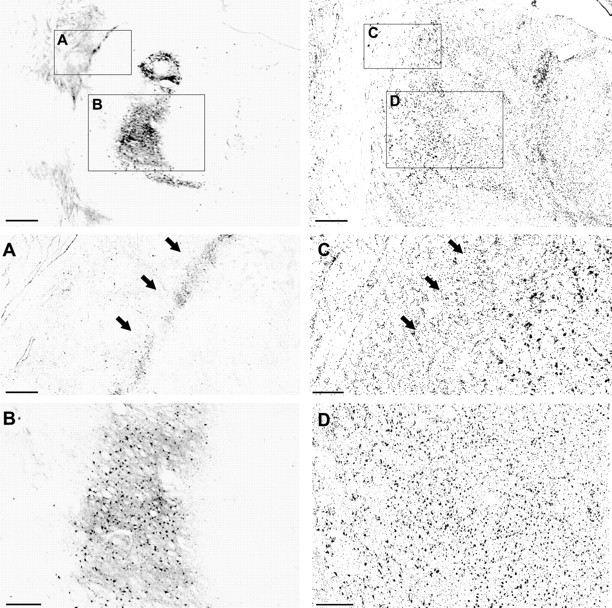
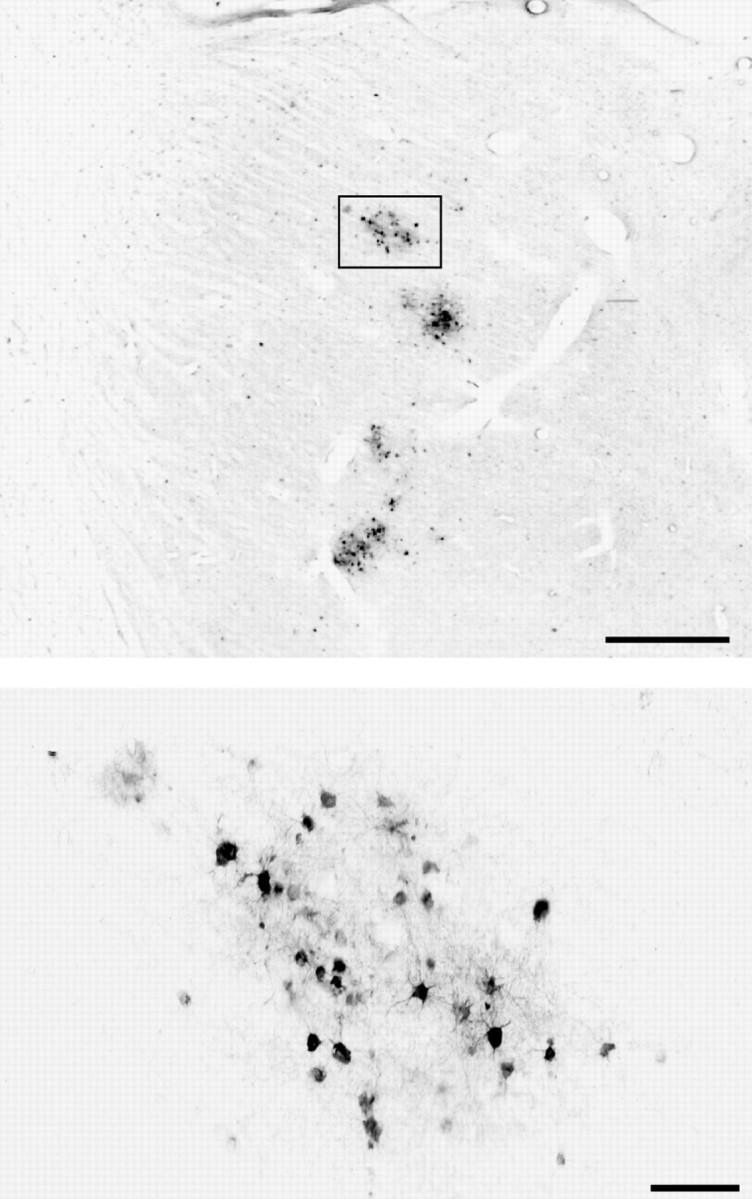
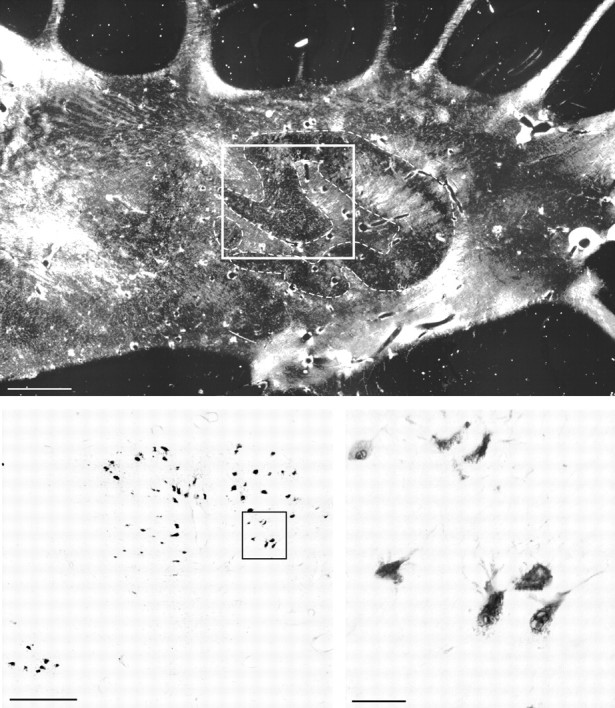
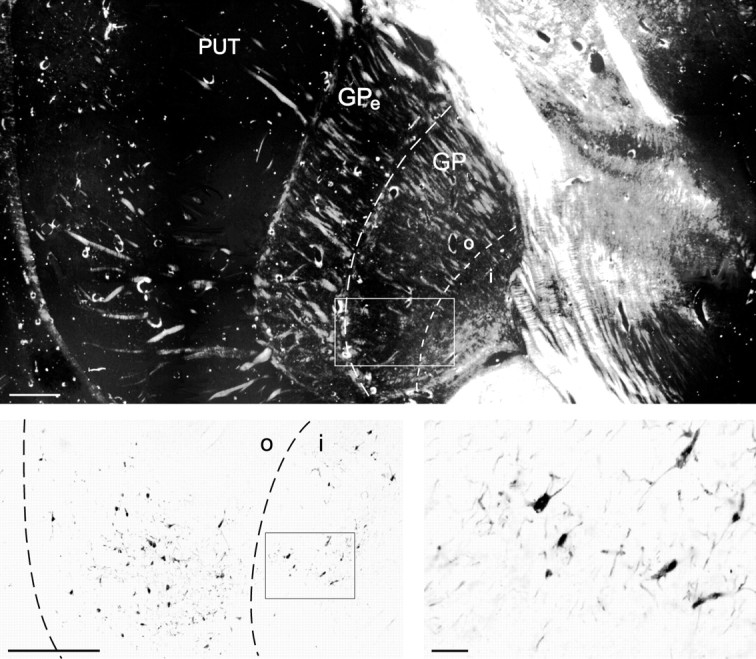
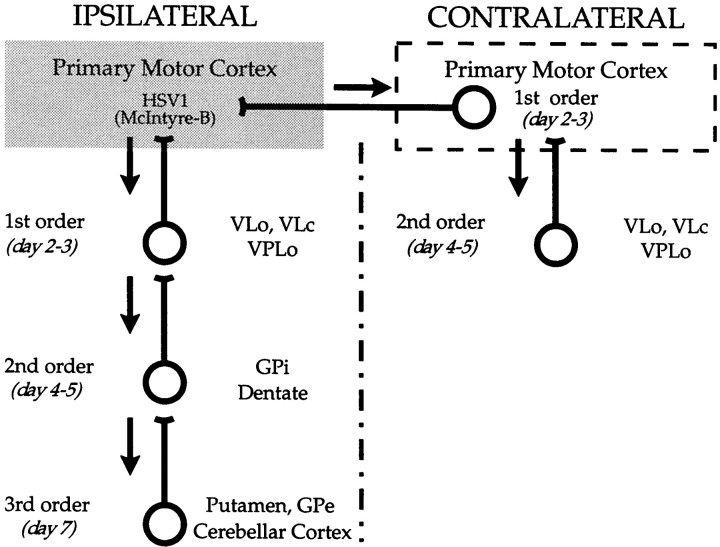
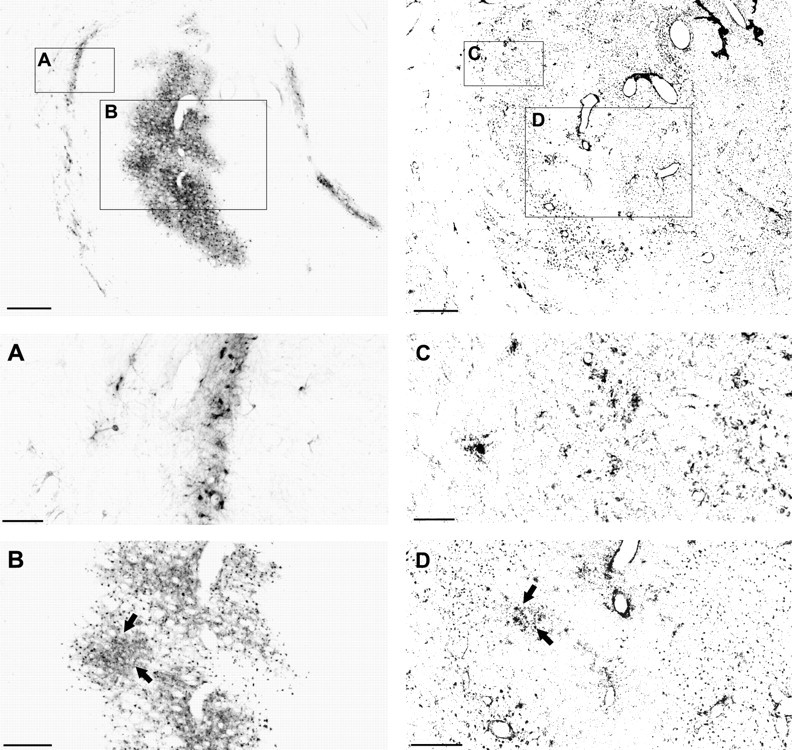
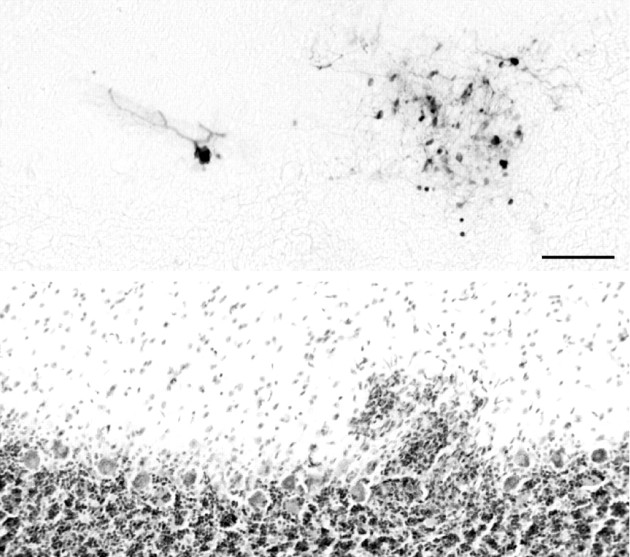
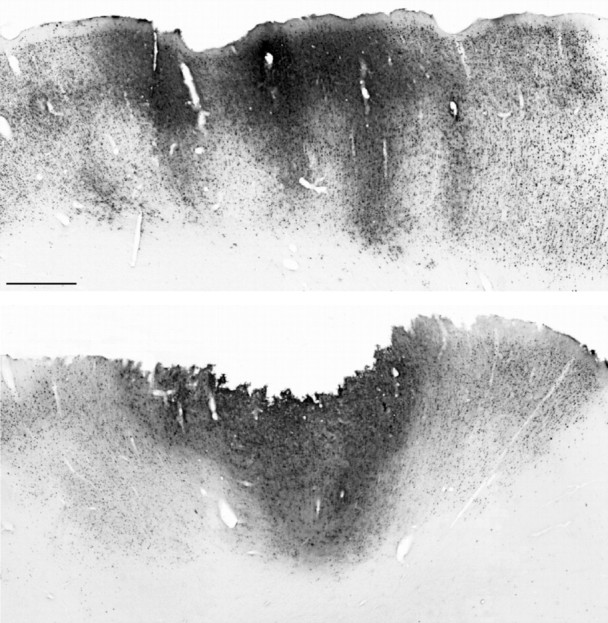
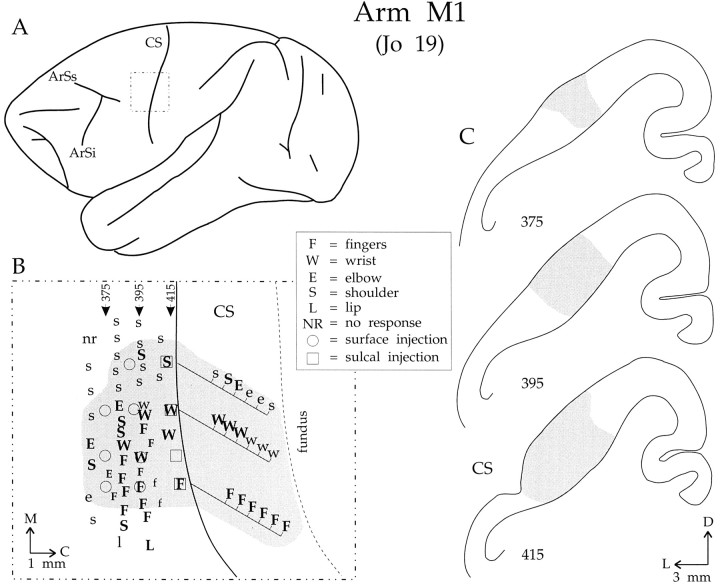
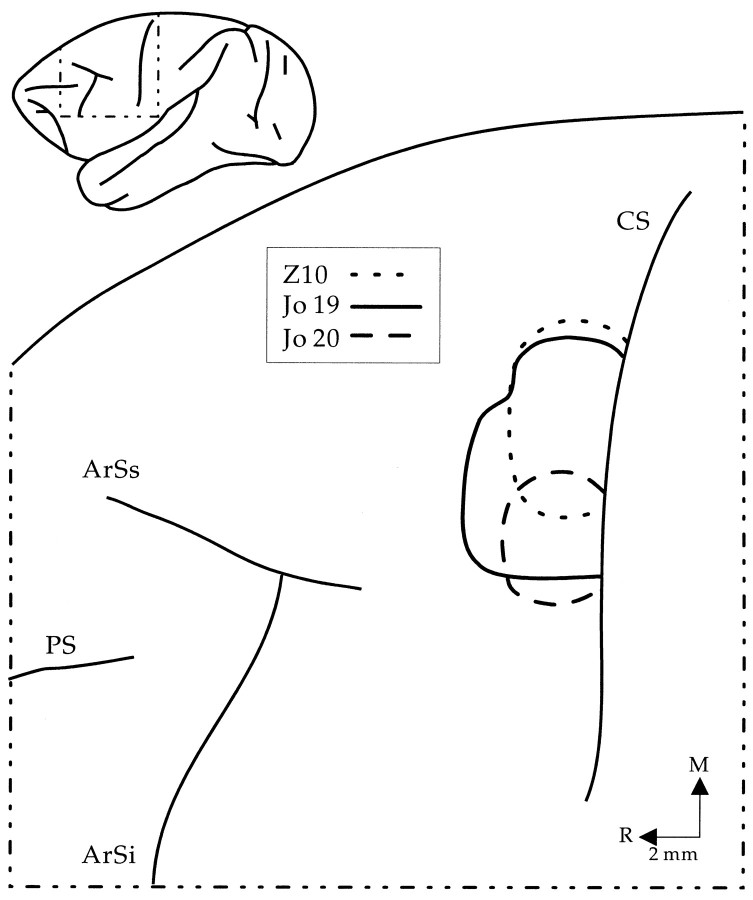
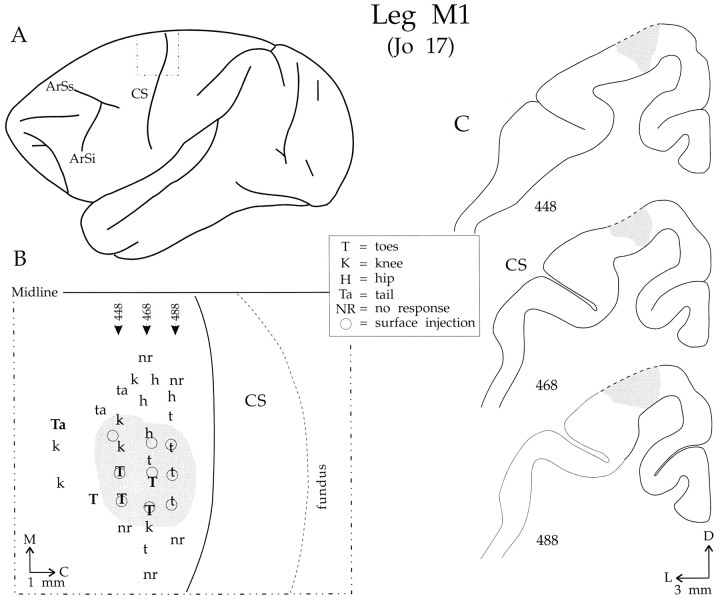
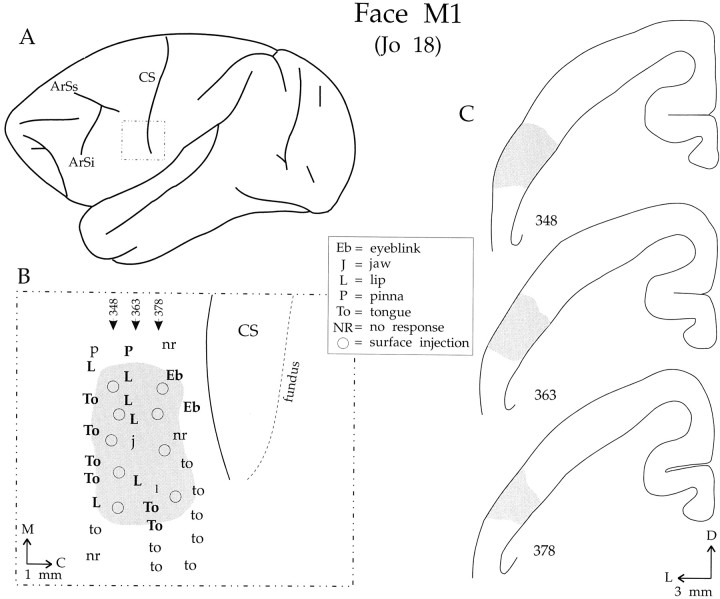
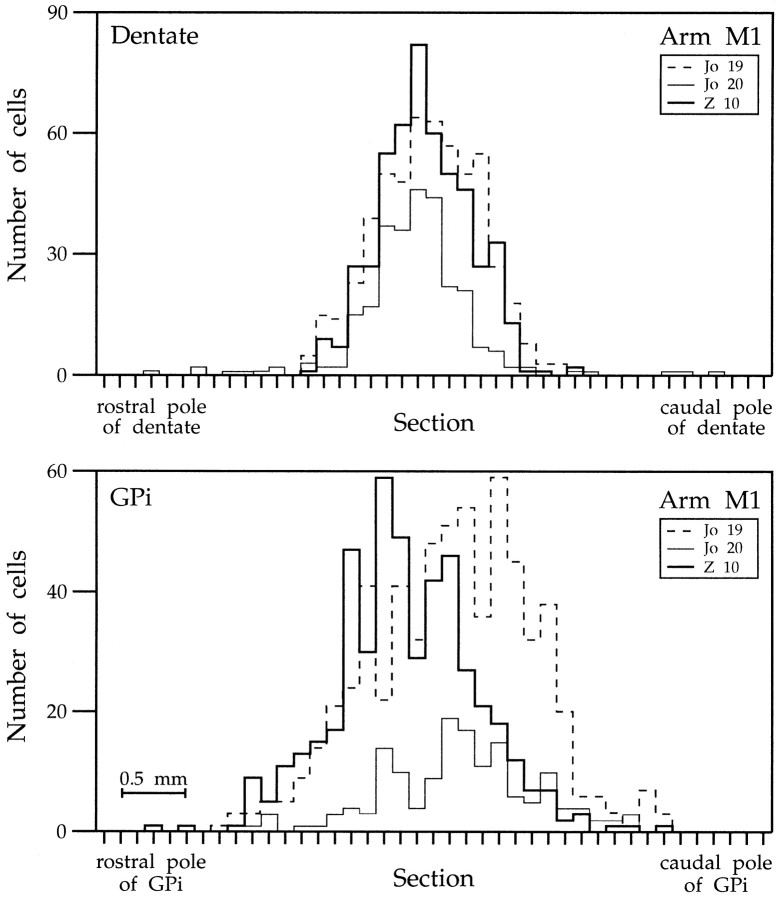
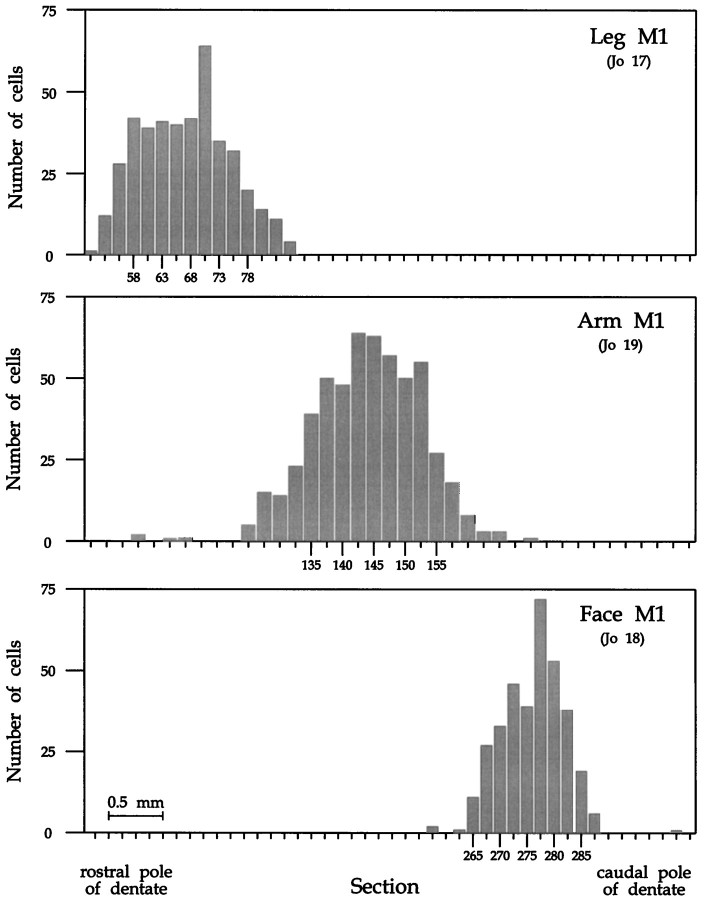
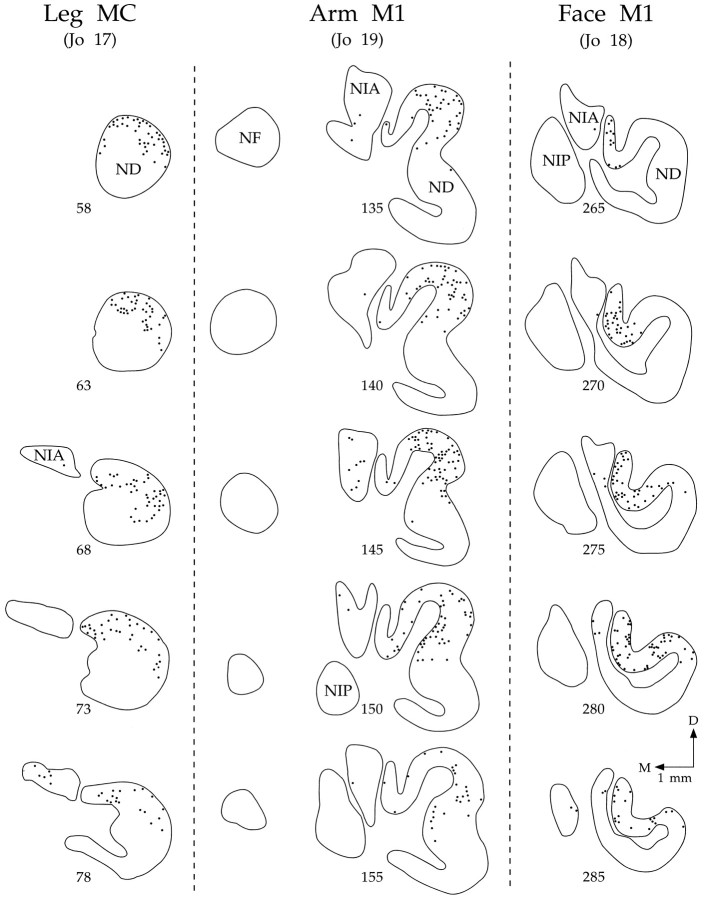
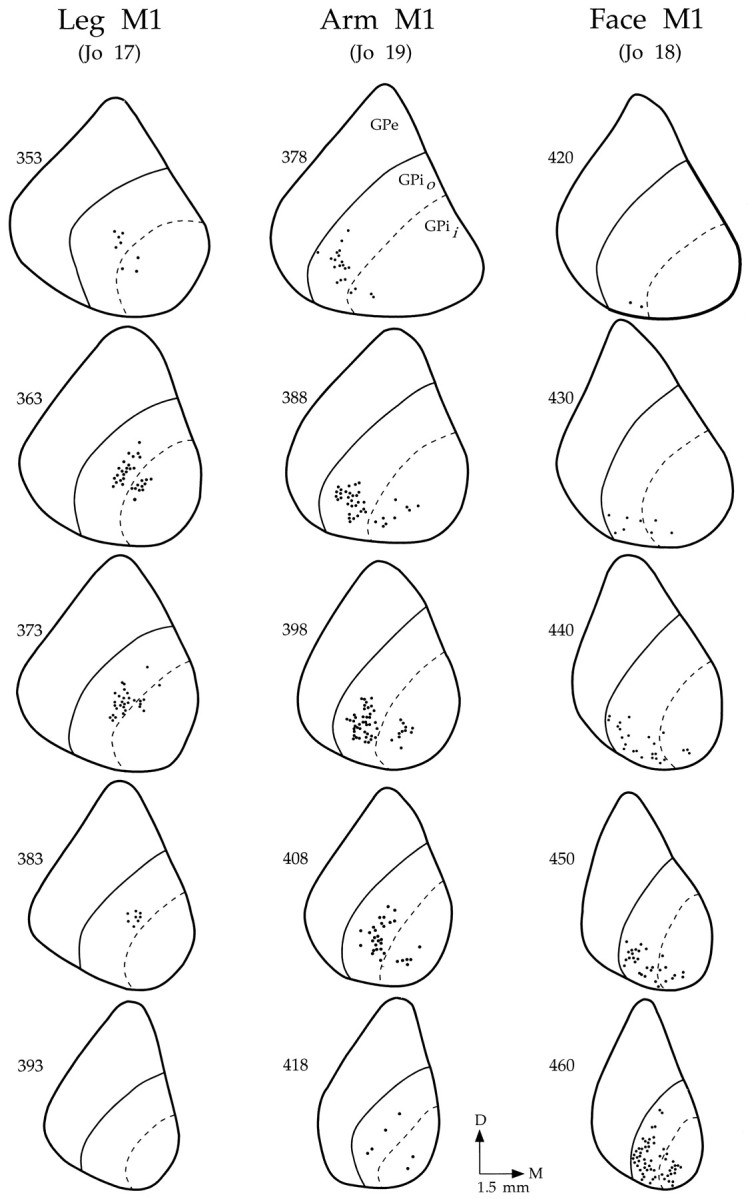
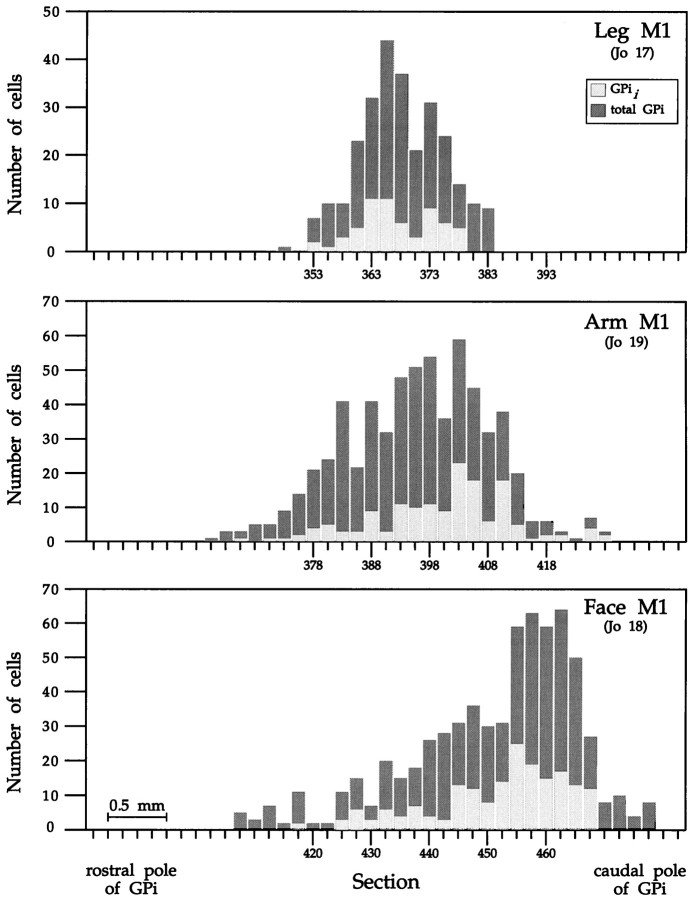
We used retrograde transneuronal transport of herpes simplex virus type 1 to map the origin of cerebellar and basal ganglia "projections" to leg, arm, and face areas of the primary motor cortex (M1). Four to five days after virus injections into M1, we observed many densely labeled neurons in localized regions of the output nuclei of the cerebellum and basal ganglia. The largest numbers of these neurons were found in portions of the dentate nucleus and the internal segment of the globus pallidus (GPi). Smaller numbers of labeled neurons were found in portions of the interpositus nucleus and the substantia nigra pars reticulata. The distribution of neuronal labeling varied with the cortical injection site. For example, within the dentate, neurons labeled from leg M1 were located rostrally, those from face M1 caudally, and those from arm M1 at intermediate levels. In each instance, labeled neurons were confined to approximately the dorsal third of the nucleus. Within GPi, neurons labeled from leg M1 were located in dorsal and medial regions, those from face M1 in ventral and lateral regions, and those from arm M1 in intermediate regions. These results demonstrate that M1 is the target of somatotopically organized outputs from both the cerebellum and basal ganglia. Surprisingly, the projections to M1 originate from only 30% of the volume of the dentate and <15% of GPi. Thus, the majority of the outputs from the cerebellum and basal ganglia are directed to cortical areas other than M1.
Figures
Similar articles
-
Anatomical evidence for cerebellar and basal ganglia involvement in higher cognitive function.Science. 1994 Oct 21;266(5184):458-61. doi: 10.1126/science.7939688. Science. 1994. PMID: 7939688
-
Supplementary motor area and presupplementary motor area: targets of basal ganglia and cerebellar output.J Neurosci. 2007 Oct 3;27(40):10659-73. doi: 10.1523/JNEUROSCI.3134-07.2007. J Neurosci. 2007. PMID: 17913900 Free PMC article.
-
Cerebellar connections with the motor cortex and the arcuate premotor area: an analysis employing retrograde transneuronal transport of WGA-HRP.J Comp Neurol. 1989 Oct 22;288(4):612-26. doi: 10.1002/cne.902880408. J Comp Neurol. 1989. PMID: 2478593
-
Macro-architecture of basal ganglia loops with the cerebral cortex: use of rabies virus to reveal multisynaptic circuits.Prog Brain Res. 2004;143:449-59. doi: 10.1016/s0079-6123(03)43042-2. Prog Brain Res. 2004. PMID: 14653187 Review.
-
Neural circuits and topographic organization of the basal ganglia and related regions.Brain Dev. 2000 Sep;22 Suppl 1:S5-16. doi: 10.1016/s0387-7604(00)00139-x. Brain Dev. 2000. PMID: 10984656 Review.
Cited by
-
Cerebellar networks with the cerebral cortex and basal ganglia.Trends Cogn Sci. 2013 May;17(5):241-54. doi: 10.1016/j.tics.2013.03.003. Epub 2013 Apr 9. Trends Cogn Sci. 2013. PMID: 23579055 Free PMC article. Review.
-
Structural and functional magnetic resonance imaging of the human cerebellar nuclei.Cerebellum. 2012 Jun;11(2):314-24. doi: 10.1007/s12311-010-0194-5. Cerebellum. 2012. PMID: 20665253 Review.
-
An avian basal ganglia pathway essential for vocal learning forms a closed topographic loop.J Neurosci. 2001 Sep 1;21(17):6836-45. doi: 10.1523/JNEUROSCI.21-17-06836.2001. J Neurosci. 2001. PMID: 11517271 Free PMC article.
-
Disability and persistent motor deficits are linked to structural crossed cerebellar diaschisis in chronic stroke.Hum Brain Mapp. 2023 Nov;44(16):5336-5345. doi: 10.1002/hbm.26434. Epub 2023 Jul 20. Hum Brain Mapp. 2023. PMID: 37471691 Free PMC article.
-
Functional Alteration of Cerebello-Cerebral Coupling in an Experimental Mouse Model of Parkinson's Disease.Cereb Cortex. 2019 Apr 1;29(4):1752-1766. doi: 10.1093/cercor/bhy346. Cereb Cortex. 2019. PMID: 30715237 Free PMC article.
References
-
- Asanuma C, Thach WT, Jones EG. Anatomical evidence for segregated focal groupings of efferent cells and their terminal ramifications in the cerebellothalamic pathway of the monkey. Brain Res Rev. 1983;5:267–297. - PubMed
-
- Brooks VB, Thach WT. Cerebellar control of posture and movement. In: Brooks VB, editor. Handbook of physiology, section 1: the nervous system, Vol 2, motor control. American Physiological Society; Bethesda, MD: 1981. pp. 877–946.
-
- Card JP, Dubin JR, Whealy ME, Enquist LW. Influence of infectious dose upon productive replication and trans-synaptic passage of pseudorabies virus in rat central nervous system. J Neurovirol. 1995;1:349–358. - PubMed
-
- Carpenter MB, Nakano K, Kim R. Nigrothalamic projections in the monkey demonstrated by autoradiographic technics. J Comp Neurol. 1976;165:401–416. - PubMed
-
- Darian-Smith C, Darian-Smith I, Cheema SS. Thalamic projections to sensorimotor cortex in the macaque monkey: use of multiple retrograde fluorescent tracers. J Comp Neurol. 1990;299:17–46. - PubMed
Publication types
MeSH terms
Substances
Grants and funding
LinkOut - more resources
Full Text Sources
Miscellaneous