. 1999 Feb 8;144(3):427-34.
doi: 10.1083/jcb.144.3.427.

Arginase II downregulates nitric oxide (NO) production and prevents NO-mediated apoptosis in murine macrophage-derived RAW 264.7 cells

Affiliations

Arginase II downregulates nitric oxide (NO) production and prevents NO-mediated apoptosis in murine macrophage-derived RAW 264.7 cells

T Gotoh et al. J Cell Biol. .

Abstract

Excess nitric oxide (NO) induces apoptosis of some cell types, including macrophages. As NO is synthesized by NO synthase (NOS) from arginine, a common substrate of arginase, these two enzymes compete for arginine. There are two known isoforms of arginase, types I and II. Using murine macrophage-like RAW 264.7 cells, we asked if the induction of arginase II would downregulate NO production and hence prevent apoptosis. When cells were exposed to lipopolysaccharide (LPS) and interferon-gamma (IFN-gamma), the inducible form of NOS (iNOS) was induced, production of NO was elevated, and apoptosis followed. When dexamethasone and cAMP were further added, both iNOS and arginase II were induced, NO production was much decreased, and apoptosis was prevented. When the cells were transfected with an arginase II expression plasmid and treated with LPS/IFN-gamma, some cells were rescued from apoptosis. An arginase I expression plasmid was also effective. On the other hand, transfection with the arginase II plasmid did not prevent apoptosis when a NO donor SNAP or a high concentration (12 mM) of arginine was added. These results indicate that arginase II prevents NO-dependent apoptosis of RAW 264.7 cells by depleting intracellular arginine and by decreasing NO production.


Figures
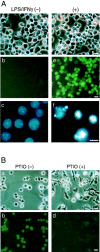
Figure 1
Figure 1
Induction of NO-mediated apoptosis of RAW cells by treatment with LPS and IFN-γ. (A) RAW cells were cultured for 24 h with (d–f) or without (a–c) 150 μg/ml LPS and 100 U/ml IFN-γ. After fixation, the cells were analyzed for apoptosis by the TUNEL method (b and e) or stained with a DNA-specific fluorochrome Hoechst dye 33258 (c and f). Phase-contrast images (a and d) and fluorescence images (b and e) of the same fields are shown. Original magnifications: a, b, d, and e, ×400; c and f, ×1,000. Bars, 10 μm. When the cells were treated with LPS/IFN-γ, a portion of the cells was apparently dead and detached from coverslips and the number of attached cells decreased. (B) RAW cells were cultured for 24 h with 150 μg/ml LPS and 100 U/ml IFN-γ. At the same time of the addition of LPS/IFN-γ, a NO scavenger carboxy-PTIO (300 μM) was added to the medium where indicated. After fixation, the cells were analyzed for apoptosis by the TUNEL method. Phase-contrast images (a and c) and fluorescence images (b and d) of the same fields are shown. Original magnifications: ×400. Bars, 10 μm.
Figure 2
Figure 2
Effect of induction of arginase II on apoptosis of RAW cells. (A) Time course of treatment of RAW cells is shown. RAW cells were cultured in the medium with or without 1 μM Dex and/or 1 mM dibutyryl cAMP (cAMP) for 24 h, and then treated with various combinations of LPS (150 μg/ml) and IFN-γ (100 U/ml) for 6 h for RNA blot analysis (B–D) or 12 h for immunoblot analysis and apoptosis assays (E–H). (B) RAW cells were treated with reagents as indicated and total RNAs (2 μg) were subjected to blot analysis for iNOS and arginase II (AII) mRNAs. The positions of 18S and 28S rRNAs are shown on the right. The bottom panels in B show ethidium bromide staining of 18S and 28S rRNAs. (C) The results in B were quantitated and are shown by means ± ranges (n = 2). Maximal values are set at 100%. (D) Experiments were performed as in B and the results for arginase II (AII) mRNA were quantitated and are shown by means ± SE (n = 3). Maximal value is set at 100%. (E) RAW cells were treated with reagents as indicated on the top and the cell extracts (30 μg) were subjected to immunoblot analysis for the arginase II (AII) protein. The molecular mass marker on the right was ovalbumin (46 kD). (F) The results in E (n = 2) and a parallel experiment (n = 2) were quantitated and are shown by means ± SE (n = 4). Maximal value is set at 100%. (G) RAW cells were cultured in the medium with or without 1 μM Dex and/or 1 mM dibutyryl cAMP for 24 h, and then treated with LPS (150 μg/ml) and IFN-γ (100 U/ml) for 12 h. After fixation, the cells were stained with Hoechst dye 33258. Phase-contrast images (a, c, e, and g) and fluorescence images (b, d, f, and h) of the same fields are shown. Original magnifications: ×400. Bars, 10 μm. The percentage of total cells which were determined to be apoptotic is shown on the bottom of each panel. (H) RAW cells were treated with reagents as indicated on the top. DNAs were isolated, resolved on an agarose gel, stained with SYBR Green I, and visualized for DNA fragmentation by UV transillumination.
Figure 2
Figure 2
Effect of induction of arginase II on apoptosis of RAW cells. (A) Time course of treatment of RAW cells is shown. RAW cells were cultured in the medium with or without 1 μM Dex and/or 1 mM dibutyryl cAMP (cAMP) for 24 h, and then treated with various combinations of LPS (150 μg/ml) and IFN-γ (100 U/ml) for 6 h for RNA blot analysis (B–D) or 12 h for immunoblot analysis and apoptosis assays (E–H). (B) RAW cells were treated with reagents as indicated and total RNAs (2 μg) were subjected to blot analysis for iNOS and arginase II (AII) mRNAs. The positions of 18S and 28S rRNAs are shown on the right. The bottom panels in B show ethidium bromide staining of 18S and 28S rRNAs. (C) The results in B were quantitated and are shown by means ± ranges (n = 2). Maximal values are set at 100%. (D) Experiments were performed as in B and the results for arginase II (AII) mRNA were quantitated and are shown by means ± SE (n = 3). Maximal value is set at 100%. (E) RAW cells were treated with reagents as indicated on the top and the cell extracts (30 μg) were subjected to immunoblot analysis for the arginase II (AII) protein. The molecular mass marker on the right was ovalbumin (46 kD). (F) The results in E (n = 2) and a parallel experiment (n = 2) were quantitated and are shown by means ± SE (n = 4). Maximal value is set at 100%. (G) RAW cells were cultured in the medium with or without 1 μM Dex and/or 1 mM dibutyryl cAMP for 24 h, and then treated with LPS (150 μg/ml) and IFN-γ (100 U/ml) for 12 h. After fixation, the cells were stained with Hoechst dye 33258. Phase-contrast images (a, c, e, and g) and fluorescence images (b, d, f, and h) of the same fields are shown. Original magnifications: ×400. Bars, 10 μm. The percentage of total cells which were determined to be apoptotic is shown on the bottom of each panel. (H) RAW cells were treated with reagents as indicated on the top. DNAs were isolated, resolved on an agarose gel, stained with SYBR Green I, and visualized for DNA fragmentation by UV transillumination.
Figure 3
Figure 3
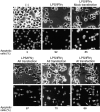
Immunocytostaining of arginase II in RAW cells. RAW cells were treated with LPS (150 μg/ml), 1 μM Dex, and 1 mM dibutyryl cAMP for 24 h to induce arginase II (B and C), or transfected with human arginase II expression plasmid pCAGGS-hAII and cultured for 36 h (D and E). The cells were then fixed and immunostained with rabbit antiserum against arginase II, as described in Materials and Methods. A is an untreated control. Original magnifications: A, B, and D, ×400; C and E, ×1000. Bars, 10 μm.
Figure 4
Figure 4
Effect of transfection of arginase expression plasmids. RAW cells were transfected with insertless pCAGGS (e and f), human arginase II expression plasmid pCAGGS-hAII (g–j), or rat arginase I expression plasmid pCAGGS-rAI (k and l). 24 h after transfection, LPS (150 μg/ml) and IFN-γ (100 U/ml) were added to the medium and cultured for 12 h. The cells were then fixed and stained with Hoechst dye 33258 except i and j that were analyzed for apoptosis by the TUNEL method after fixation. Phase-contrast images (a, c, e, g, i, and k) and fluorescence images (b, d, f, h, j, and l) of the same fields are shown. Original magnifications: ×400. Bars, 10 μm. A portion of the cells was detached from coverslips by treatment with LPS/IFN-γ (c–l). Arrows indicate cells rescued from apoptosis. The percentage of total cells which were determined to be apoptotic is shown on the bottom of each panel.
Figure 5
Figure 5
Effect of various reagents on iNOS protein (A), arginase activity (B), and NO2/NO3 production (C) in RAW cells. The cells were treated with or without 1 μM Dex and 1 mM dibutyryl cAMP for 24 h and then with LPS (150 μg/ml) and IFN-γ (100 U/ml) as indicated at the bottom for 12 h (A and B) or 18 h (C). (A) Cell extracts (30 μg protein) were subjected to immunoblot analysis for iNOS protein and the immunoblots were quantitated and are shown by means ± SE (n = 3). Maximal value is set at 100%. (B) Arginase activity of the cell extracts was measured and the results are shown by means ± SE (n = 3). (C) NO2 plus NO3 in the medium was measured and the results are shown by means ± SE (n = 3).

Similar articles

Cited by

References

    1. Akaike T, Yoshida M, Miyamoto Y, Sato K, Kohno M, Sasamoto K, Miyazaki K, Ueda S, Maeda H. Antagonistic action of imidazolineoxyl N-oxides against endothelium-derived relaxing factor/NO through a radical reaction. Biochemistry. 1993;32:827–832. - PubMed
    1. Albina JE, Cui S, Mateo RB, Reichner JS. Nitric oxide-mediated apoptosis in murine peritoneal macrophages. J Immunol. 1993;150:5080–5085. - PubMed
    1. Auphan N, DiDonato JA, Rosette C, Helmberg A, Karin M. Immunosuppression by glucocorticoids: inhibition of NF-κB activity through induction of IκB synthesis. Science. 1995;270:286–290. - PubMed
    1. Blanco FJ, Ochs RL, Schwarz H, Lotz M. Chondrocyte apoptosis induced by nitric oxide. Am J Pathol. 1995;146:75–85. - PMC - PubMed
    1. Bonfoco E, Krainc D, Ankarcrona M, Nicotera P, Lipton SA. Apoptosis and necrosis: two distinct events induced, respectively, by mild and intense insults with N-methyl-d-aspartate or nitric oxide/superoxide in cortical cell cultures. Proc Natl Acad Sci USA. 1995;92:7162–7166. - PMC - PubMed

Publication types

MeSH terms