. 1999 Feb 1;162(3):1466-79.

Elevation of mitochondrial transmembrane potential and reactive oxygen intermediate levels are early events and occur independently from activation of caspases in Fas signaling

Affiliations

Elevation of mitochondrial transmembrane potential and reactive oxygen intermediate levels are early events and occur independently from activation of caspases in Fas signaling

K Banki et al. J Immunol. .

Abstract

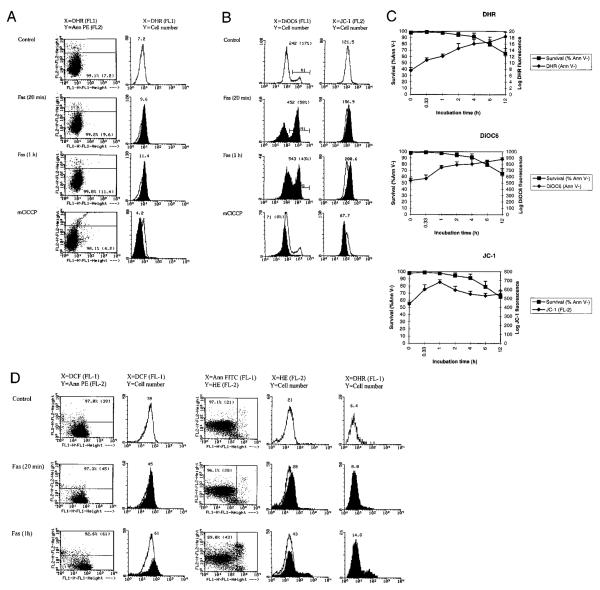
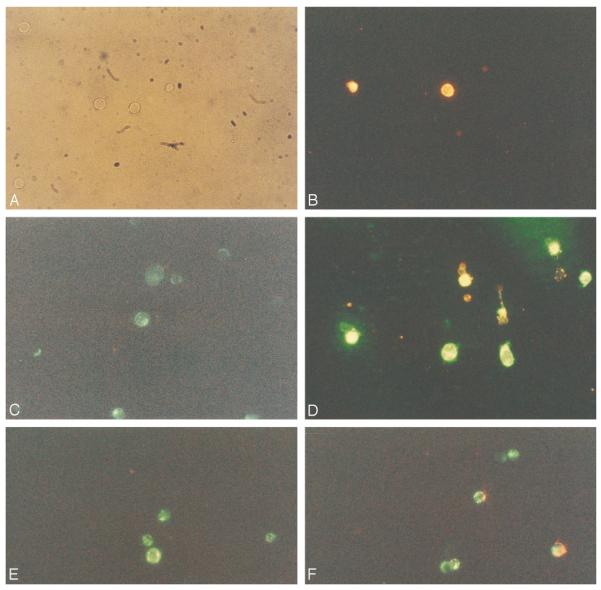
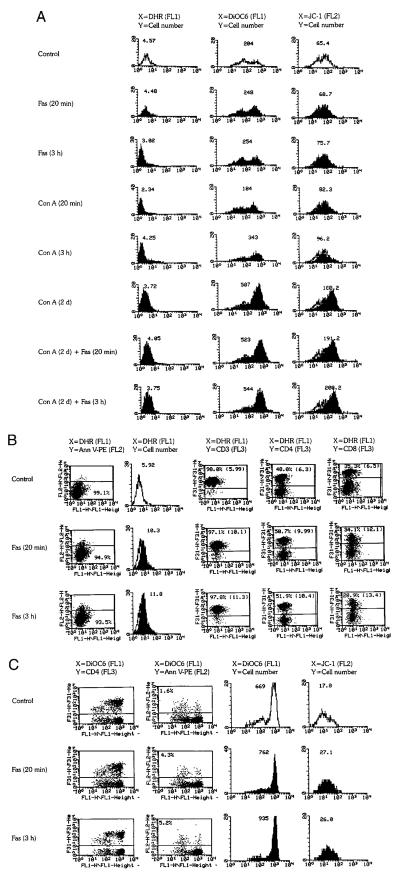
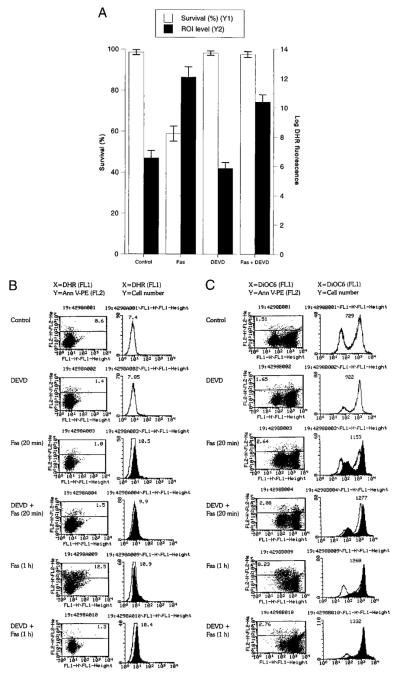
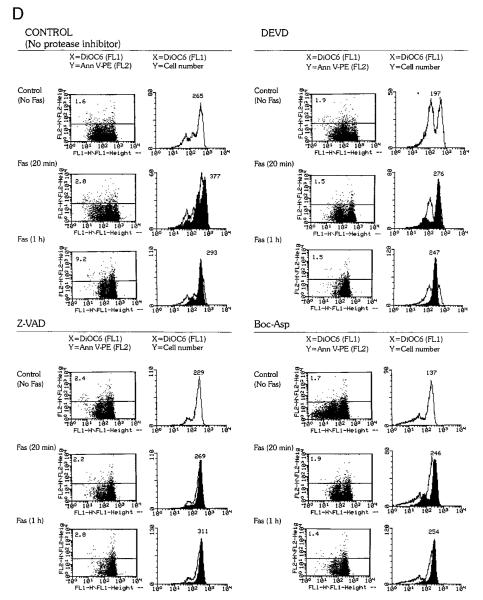
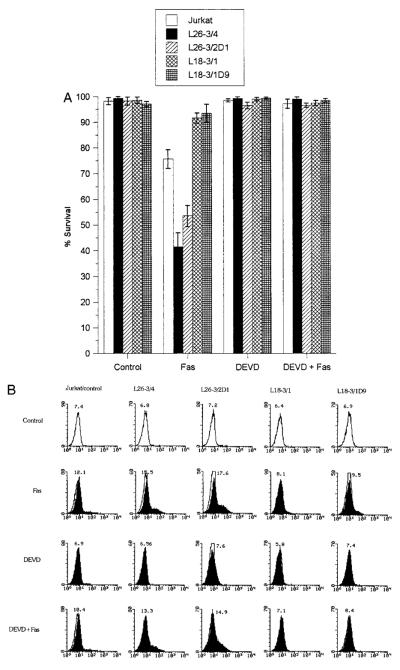
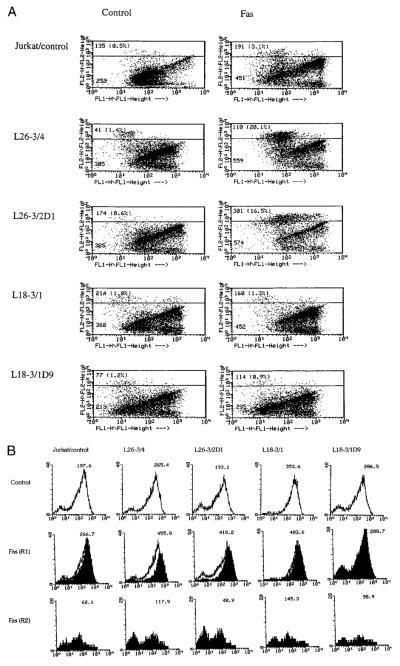
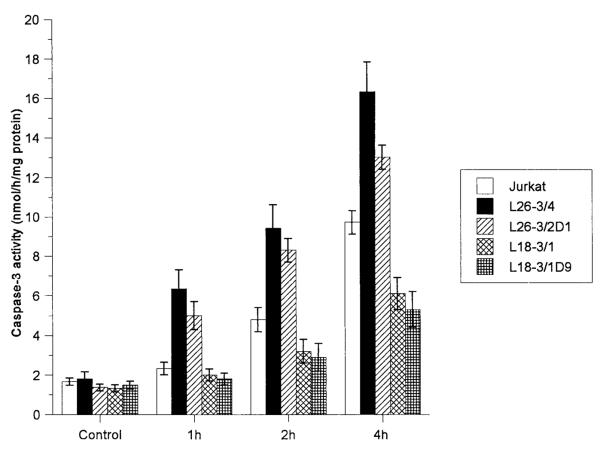
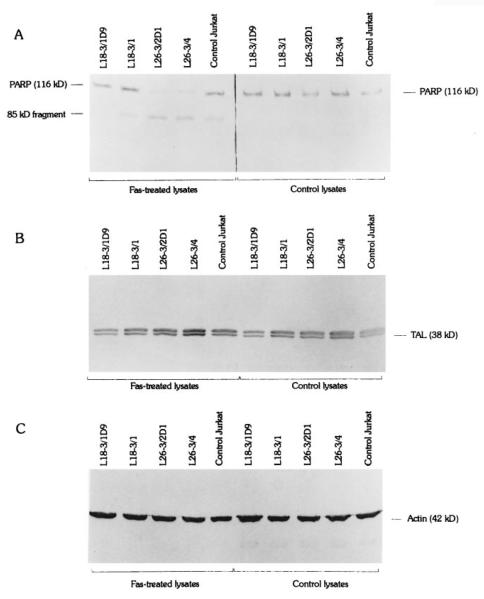
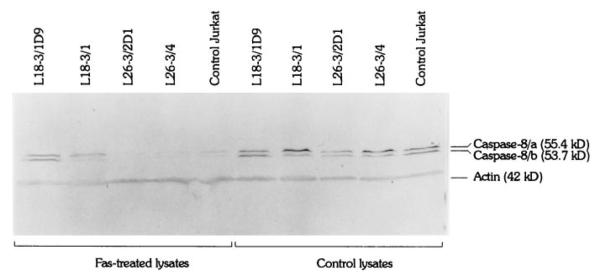
Stimulation of the CD95/Fas/Apo-1 receptor leads to apoptosis through activation of the caspase family of cysteine proteases and disruption of the mitochondrial transmembrane potential (Deltapsim). We show that, in Jurkat human T cells and peripheral blood lymphocytes, Fas-induced apoptosis is preceded by 1) an increase in reactive oxygen intermediates (ROI) and 2) an elevation of Deltapsim. These events are followed by externalization of phosphatidylserine (PS), disruption of Deltapsim, and cell death. The caspase inhibitor peptides, DEVD-CHO, Z-VAD.fmk, and Boc-Asp.fmk, blocked Fas-induced PS externalization, disruption of Deltapsim, and cell death, suggesting that these events are sequelae of caspase activation. By contrast, in the presence of caspase inhibitors, ROI levels and Deltapsim of Fas-stimulated cells remained elevated. Because ROI levels and Deltapsim are regulated by the supply of reducing equivalents from the pentose phosphate pathway (PPP), we studied the impact of transaldolase (TAL), a key enzyme of the PPP, on Fas signaling. Overexpression of TAL accelerated Fas-induced mitochondrial ROI production, Deltapsim elevation, activation of caspase-8 and caspase-3, proteolysis of poly(A)DP-ribose polymerase, and PS externalization. Additionally, suppression of TAL diminished these activities. Therefore, by controlling the balance between mitochondrial ROI production and metabolic supply of reducing equivalents through the PPP, TAL regulates susceptibility to Fas-induced apoptosis. Early increases in ROI levels and Deltapsim as well as the dominant effect of TAL expression on activation of caspase-8/Fas-associated death domain-like IL-1beta-converting enzyme, the most upstream member of the caspase cascade, suggest a pivotal role for redox signaling at the initiation of Fas-mediated apoptosis.


Figures

FIGURE 1
FIGURE 1
Flow cytometric analysis of mitochondrial ROI production and transmembrane potential (ΔΨm) in Fas-stimulated Jurkat cells. Cells were analyzed after exposure to 50 ng/ml Fas Ab for 20 min (on ice) and 1 h (at 37°C). Dead cells and debris were gated out by forward (FSC) and side (SSC) scatter measurements. A, PS externalization and ROI production were concurrently monitored by staining with annexin V-PE (FL-2) and DHR (FL-1), respectively (dot plot, left column). The Fas-induced increase in ROI levels is shown by overlay of DHR fluorescence of annexin V-negative populations (histograms, right column). Open curves correspond to control cells, while shaded curves represent Fas-treated cells. The x-axis shows the log FL-1 fluorescence intensity; the y-axis indicates the cell number. Values over curves indicate the mean channel of DHR fluorescence of control (0 min) and Fas-treated cells (20 min and 1 h). B, Left column, DiOC6 fluorescence (FL-1) of annexin V-PE-negative cells. The mean channel of histograms and the percentage of cells with increased ΔΨm (in parentheses) are shown for control (open curve) and Fas-treated (shaded curve) cells. B, Right column, JC-1 fluorescence (FL-2) of Fas-stimulated (shaded histogram) and control (open histogram) cells. As a control, reduced ΔΨm was measured in the presence of mClCCP, an uncoupling agent that reduces ΔΨm. C, Time course of ROI production and changes in Δ Ψm in response to stimulation of Jurkat cells with 50 ng/ml CH-11. Survival was assessed by flow cytometric determination of the percent of annexin V-PE-negative cells at the time points indicated. ROI production was measured in log fluorescence intensity after labeling with DHR. ΔΨm was assessed by DiOC6 (FL-1) and JC-1 fluorescence (FL-2). The fluorescence of control cells served as a baseline for each experiment. Data represent the mean ± SE of four or more independent experiments. Based on six independent experiments, the mean channel of DHR fluorescence was increased after 20-min stimulation with Fas Ab from a baseline of 7.8 ± 0.5 to 11.5 ± 0.7 by 3.7 ± 0.7 (p < 0.01). D, Flow cytometric analysis of intracellular ROI levels in Fas-stimulated Jurkat cells using DCFH-DA, HE, and DHR. PS externalization and ROI production were concurrently monitored by annexin V-PE (FL-2) and DFC (FL-1) or annexin V-FITC (FL-1) and HE (FL-2) staining, respectively (dot plots, columns 1 and 3). The Fas-induced increase in ROI levels is shown by an overlay of DCF or HE fluorescence of annexin V-negative populations (histograms, columns 2 and 4). DHR fluorescence was measured in parallel (column 5). Values over curves indicate the mean channel of DCF, HE, or DHR fluorescence of control (0 min) and Fas-treated cells (20 min and 1 h). Open curves correspond to control cells, while shaded curves represent Fas-treated cells. Data are representative of four independent experiments.
FIGURE 2
FIGURE 2
Fluorescence microscopy of control (A, C, and E) and Fas-treated Jurkat cells (B, D, and F) stained with potentiometric dyes DiOC6 and JC-1. Jurkat cells were cultured for 1 h in the absence (control) or the presence of 50 ng/ml Fas Ab CH-11. A and B were stained with annexin V-PE. In A, in the absence of fluorescence, cells illuminated with visible light are shown. C and D were stained with annexin V-PE (red) and DiOC6 (green). C shows green fluorescence only. D shows increased green (DiOC6) fluorescence of annexin V-negative cells; bright yellow cells show concurrent DiOC6 and annexin V-PE staining; shrunken cells with red annexin V-PE staining displayed diminished green (DiOC6) fluorescence. E and F were stained with JC-1. Green fluorescence was detected in control cells (E), while green and red fluorescence was noted in Fas-stimulated cell populations (F). Magnifications, ×400.
FIGURE 3
FIGURE 3
Flow cytometric analysis of ROI production and mitochondrial transmembrane potential (ΔΨm) in PBL. A, PBL, freshly purified or prestimulated with Con A for 2 days (Con A, 2d), were incubated with 1 μg/ml Fas mAb CH-11 for 20 min on ice or 3 h at 37°C. As controls, freshly isolated PBL stimulated with Con A for 20 min on ice or 3 h at 37°C were also examined. Dead cells and debris were gated out by FSC/SSC measurements. ROI production was assessed by DHR fluorescence (mean channel, FL-1) of annexin V-PE (FL-2)-negative cells. Open curves correspond to control cells, while shaded curves represent Con A- and/or Fas-treated cells, as indicated for each histogram. The x-axis shows the log FL-1 fluorescence intensity; the y-axis indicates the cell number. Δψm was measured by DiOC6 fluorescence (FL-1) of annexin V-PE-negative cells or JC-1 fluorescence (FL-2) of live cells based on forward/side scatter (FSC/SSC) gating. Values over curves indicate the mean channels of DHR, DiOC6, and JC-1 fluorescence. B, Fas-induced mitochondrial ROI production in PBL prestimulated with 5 μg/ml Con A for 5 days. After prestimulation with Con A, PBL were incubated with 1 μg/ml Fas Ab CH-11. ROI production was assessed by DHR fluorescence (FL-1). PS externalization was determined by annexin V-PE staining (FL-2). Column 1 shows the percentage of annexin V-PE-negative cells and their right shift on the FL-1 axis. Column 2 shows histogram and mean channel number of DHR fluorescence of annexin V-PE-negative cells. T cells and their CD4 and CD8 subsets were identified by staining with Quantum Red-conjugated CD3, CD4, and CD8 Abs, respectively (FL-3). Columns 3–5 indicate the percentages of CD3-, CD4-, and CD8-stained cells and their mean DHR fluorescence (in parentheses) gated on annexin V-PE-negative cells. C, Fas-induced ΔΨm changes in PBL prestimulated with Con A for 5 days. Column 1 shows increased DiOC6 (FL-1) fluorescence of both CD4 and CD4+ compartments of PBL (FL-3) gated on annexin V-PE-negative cells in response to Fas stimulation. Column 2 shows the percentage of annexin V-PE-positive cells and increased DiOC6 fluorescence (right shift) of annexin V-negative cells. Column 3 indicates the histogram and mean channel of DiOC6 fluorescence gated on annexin V-PE-negative cells. Column 4 shows the histogram and mean channel of JC-1 fluorescence (FL-2) of live cells based on FSC/SSC gating. Data are representative of five independent experiments.
FIGURE 4
FIGURE 4
Effects of caspase-3 inhibitor DEVD-CHO on Fas-induced mitochondrial ROI production, Δψm, and cell death. Jurkat cells were preincubated in the presence or the absence of DEVD (300 μM) for 3 h. A, Survival and ROI levels were evaluated by trypan blue exclusion and DHR fluorescence, respectively, 24 h after stimulation with Fas Ab. The fluorescence of control cells served as the baseline for each experiment. The data show the mean ± SE of four experiments. In comparison to untreated control cells, DHR fluorescence was elevated in Fas-treated or Fas- plus DEVD-treated cells (p < 0.001). B, Time course of Fas-induced mitochondrial ROI production in DEVD-pretreated cells (300 μM, 3 h). ROI levels were assessed by DHR fluorescence (FL-1) in annexin V-PE (FL-2)-negative cells after stimulation with 50 ng/ml CH11 Fas Ab for 20 min on ice or 1 h at 37°C. C, Effect of Fas stimulation on Δψm of DEVD-pretreated cells. Δψm was assessed by DiOC6 fluorescence (FL-1) in annexin V-PE (FL-2)-negative and -positive cells. Left panel, Increased DiOC6 fluorescence in annexin V-PE (FL-2) negative and decreased DiOC6 fluorescence in annexin V-PE-positive cells in response to Fas stimulation. The percentage of annexin V-positive cells is shown in the upper left corner. Right panel, The histogram and mean channel number of DiOC6 fluorescence in annexin V-PE (FL-2)-negative cells. D, Effect of Fas stimulation on Δψm of Jurkat cells pretreated for 3 h with 300 μM DEVD, 50 μM Z-VAD, or 50 μM Boc-Asp. The Δψm was assessed by DiOC6 fluorescence (FL-1) in annexin V-PE (FL-2)-negative and -positive cells (left panels). The percentage of annexin V-positive cells is shown in the upper left corner. Right panels, The histogram and mean channel number of DiOC6 fluorescence in annexin V-PE (FL-2)-negative cells. Data are representative of three independent experiments.
FIGURE 4
FIGURE 4
Effects of caspase-3 inhibitor DEVD-CHO on Fas-induced mitochondrial ROI production, Δψm, and cell death. Jurkat cells were preincubated in the presence or the absence of DEVD (300 μM) for 3 h. A, Survival and ROI levels were evaluated by trypan blue exclusion and DHR fluorescence, respectively, 24 h after stimulation with Fas Ab. The fluorescence of control cells served as the baseline for each experiment. The data show the mean ± SE of four experiments. In comparison to untreated control cells, DHR fluorescence was elevated in Fas-treated or Fas- plus DEVD-treated cells (p < 0.001). B, Time course of Fas-induced mitochondrial ROI production in DEVD-pretreated cells (300 μM, 3 h). ROI levels were assessed by DHR fluorescence (FL-1) in annexin V-PE (FL-2)-negative cells after stimulation with 50 ng/ml CH11 Fas Ab for 20 min on ice or 1 h at 37°C. C, Effect of Fas stimulation on Δψm of DEVD-pretreated cells. Δψm was assessed by DiOC6 fluorescence (FL-1) in annexin V-PE (FL-2)-negative and -positive cells. Left panel, Increased DiOC6 fluorescence in annexin V-PE (FL-2) negative and decreased DiOC6 fluorescence in annexin V-PE-positive cells in response to Fas stimulation. The percentage of annexin V-positive cells is shown in the upper left corner. Right panel, The histogram and mean channel number of DiOC6 fluorescence in annexin V-PE (FL-2)-negative cells. D, Effect of Fas stimulation on Δψm of Jurkat cells pretreated for 3 h with 300 μM DEVD, 50 μM Z-VAD, or 50 μM Boc-Asp. The Δψm was assessed by DiOC6 fluorescence (FL-1) in annexin V-PE (FL-2)-negative and -positive cells (left panels). The percentage of annexin V-positive cells is shown in the upper left corner. Right panels, The histogram and mean channel number of DiOC6 fluorescence in annexin V-PE (FL-2)-negative cells. Data are representative of three independent experiments.
FIGURE 5
FIGURE 5
Fas-induced mitochondrial ROI production and cell death in the presence and the absence of DEVD-CHO in Jurkat cells stably transfected with TAL-H expression vectors. L26-3/4 and L26-3/2D1 cells were transfected with the sense construct. L18-3/1 and L18-3/1D9 cells were transfected with the antisense construct. After pretreatment with or without 300 μM DEVD-CHO for 3 h, cells were stimulated with Fas Ab CH-11. A, The rate of cell death was determined by staining with annexin V-FITC. Data represent the mean ± SE of five experiments. Survival was diminished in L26-3/4 (p < 0.001) and L26-3/2D1 cells (p < 0.005). Cell death was inhibited in L18-3/1 and L18-3/1D9 cells (p < 0.001). B, Changes in ROI levels in response to stimulation with 50 ng/ml Fas Ab for 1 h were monitored by DHR fluorescence (FL-1) in annexin V-PE-negative cells. The histogram and mean channel number of DHR fluorescence, with and without DEVD-CHO pretreatment, in L26-3/4, L26-3/2D1, L18-3/1, L18-3/1D9, and control Jurkat cells are indicated.
FIGURE 6
FIGURE 6
Fas-induced changes in Δψm following 1-h stimulation with 50 ng/ml CH-11 Ab of Jurkat cells stably transfected with TAL-H expression vectors. A, Δψm was assessed by DiOC6 fluorescence (FL-1) in annexin V-PE (FL-2)-positive and -negative cells. The mean channel of DiOC6 fluorescence of annexin V-PE-negative and -positive cells (percent distribution in parentheses) is indicated in each dot plot. B, Δψm was assessed by measurement of JC-1 fluorescence (FL-2) in live (R1) and dead (R2) cell populations based on FSC/SSC measurements. Values over histograms indicate the mean channel of JC-1 fluorescence.
FIGURE 7
FIGURE 7
Rate of caspase-3 activity in Jurkat cells stably transfected with TAL-H expression vectors during Fas-induced apoptosis. Protease activity was measured by cleavage of DEVD-AFC in cell extracts prepared at the time points indicated. Data show the mean ± SE of four experiments.
FIGURE 8
FIGURE 8
A, Cleavage of PARP (116 kDa) to 85-kDa fragment during Fas-induced apoptosis of Jurkat cells stably transfected with TAL-H expression vectors. Six hours after stimulation with 50 ng/ml Fas Ab, PARP cleavage was accelerated in L26-3/4 and L26-3/2D1 cells and was abrogated in L18-3/1 and L18-3/1D9 cells compared with that in control Jurkat cells (left panel). PARP was not cleaved in lysates of cells unstimulated with Fas Ab (right panel). Cell lysates containing 40 μg of total protein/lane were prepared and analyzed by Western blot using anti-PARP mAb C-2-10. B, Monitoring of TAL expression using Ab 170. Levels of TAL expression were reduced in L18-3/1D9 (−29%) and L18-3/1 (−48%) cells and were increased in L26-3/4 (2.5-fold) and L26-3/2D1 (+31%) cells compared with those in control Jurkat cells as previously described (27). C, Actin was detected with mAb C4.
FIGURE 9
FIGURE 9
Proteolysis of FLICE/caspase-8 isoforms caspase-8/a and caspase-8/b during Fas-induced apoptosis of Jurkat cells stably transfected with TAL-H expression vectors. Four hours after stimulation with 50 ng/ml Fas Ab, cleavage of caspase-8 was accelerated in L26-3/4 and L26-3/2D1 cells and was abrogated in L18-3/1 and L18-3/1D9 cells compared with that in control Jurkat cells (left panel). Caspase-8 was not cleaved in lysates of cells unstimulated with Fas Ab (right panel). Cell lysates containing 40 μg of total protein/lane were prepared and analyzed by Western blot using anti-caspase-8 mAb 5F7. Actin was detected with mAb C4.

References

    1. Wyllie AH, Kerr JFR, Currie AE. Cell death: the significance of apoptosis. Int. Rev. Cytol. 1980;68:251. - PubMed
    1. Nagata S, Golstein P. The Fas death factor. Science. 1995;267:1449. - PubMed
    1. Thompson CB. Apoptosis in the pathogenesis and treatment of disease. Science. 1995;267:1456. - PubMed
    1. Nagata S. Apoptosis by death factor. Cell. 1997;88:355. - PubMed
    1. Itoh N, Nagata S. A novel protein domain required for apoptosis: mutational analysis of human Fas antigen. J. Biol. Chem. 1993;268:10932. - PubMed

Publication types

LinkOut - more resources