. 2017 May 31;4(2):263-282.
doi: 10.1016/j.jcmgh.2017.05.005. eCollection 2017 Sep.

Acinar-to-Ductal Metaplasia Induced by Transforming Growth Factor Beta Facilitates KRASG12D-driven Pancreatic Tumorigenesis

Affiliations

Acinar-to-Ductal Metaplasia Induced by Transforming Growth Factor Beta Facilitates KRASG12D-driven Pancreatic Tumorigenesis

Nicolas Chuvin et al. Cell Mol Gastroenterol Hepatol. .

Abstract

Background & aims: Transforming growth factor beta (TGFβ) acts either as a tumor suppressor or as an oncogene, depending on the cellular context and time of activation. TGFβ activates the canonical SMAD pathway through its interaction with the serine/threonine kinase type I and II heterotetrameric receptors. Previous studies investigating TGFβ-mediated signaling in the pancreas relied either on loss-of-function approaches or on ligand overexpression, and its effects on acinar cells have so far remained elusive.

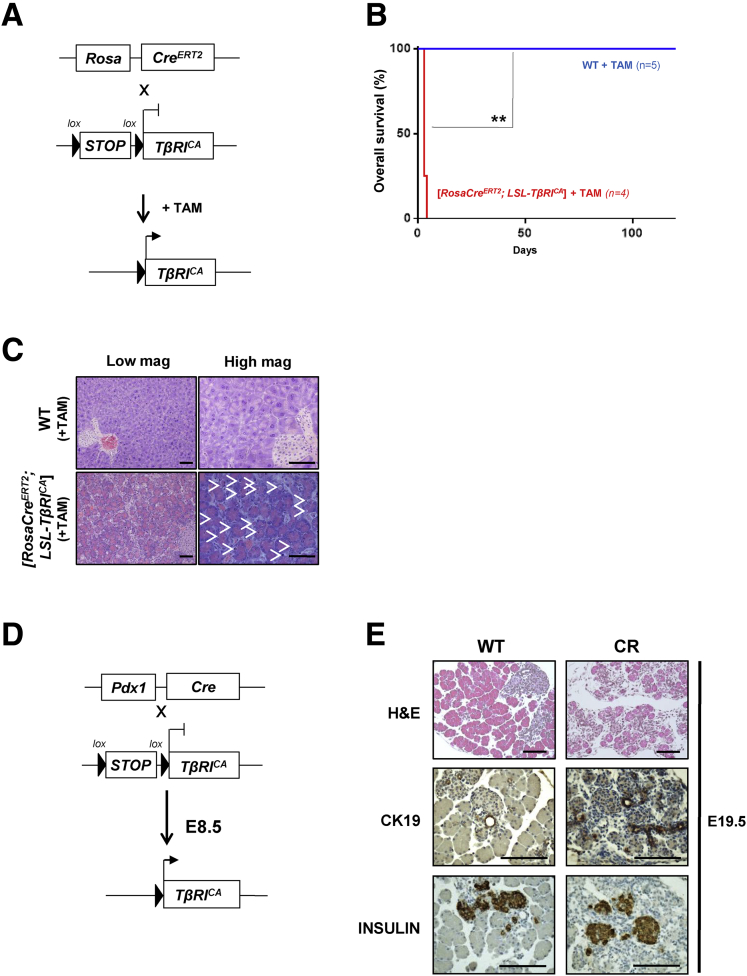
Methods: We developed a transgenic mouse model allowing tamoxifen-inducible and Cre-mediated conditional activation of a constitutively active type I TGFβ receptor (TβRICA) in the pancreatic acinar compartment.

Results: We observed that TβRICA expression induced acinar-to-ductal metaplasia (ADM) reprogramming, eventually facilitating the onset of KRASG12D-induced pre-cancerous pancreatic intraepithelial neoplasia. This phenotype was characterized by the cellular activation of apoptosis and dedifferentiation, two hallmarks of ADM, whereas at the molecular level, we evidenced a modulation in the expression of transcription factors such as Hnf1β, Sox9, and Hes1.

Conclusions: We demonstrate that TGFβ pathway activation plays a crucial role in pancreatic tumor initiation through its capacity to induce ADM, providing a favorable environment for KRASG12D-dependent carcinogenesis. Such findings are highly relevant for the development of early detection markers and of potentially novel treatments for pancreatic cancer patients.

Keywords: ADM, acinar-to-ductal metaplasia; AFI, acinar fatty infiltration; Acinar-to-Ductal Metaplasia; Cancer; EMT, epithelial-to-mesenchymal transition; KRASG12D; PBS, phosphate-buffered saline; PDA, pancreatic ductal adenocarcinoma; PanIN, pancreatic intraepithelial neoplasia; Pancreas; RT-qPCR, reverse transcription quantitative polymerase chain reaction; TGFβ; TGFβ, transforming growth factor beta; TUNEL, terminal deoxynucleotidyl transferase dUTP nick end labeling.


Figures

None
Graphical abstract
Figure 1
Figure 1
KRASG12Dpotentiates TGFβ-mediated cell growth inhibition of AR42J rat pancreatic acinar cells. (A) Immunoblot of RAS-GTP and total RAS on AR42J-WT and AR42J-KRASG12D protein extracts. (B) Phase microscopy of AR42J-WT and AR42J-KRASG12D cells 48 hours after TGFβ treatment. Insets represent higher magnifications fields. Scale bar, 50 μm/L. NT, untreated. *Apoptotic cells. (C) Cell count of AR42J-WT and AR42J-KRASG12D cells at indicated times after TGFβ treatment. Representative experiment performed in duplicate (means ± standard deviation) is shown. (D) Immunoblot of SMAD proteins after 2-hour TGFβ treatment.
Figure 2
Figure 2
KRASG12Dand TGFβ cooperate to activate apoptosis of AR42J rat acinar cells. (A) Caspase-3 assay after 12-hour TGFβ treatment. (B) TUNEL assay after 24-hour TGFβ treatment. Upper panel, fluorescence microscopy. Lower panel, graphs showing percentage of TUNEL-positive cells under fluorescence microscopy and counted in each condition (>1000 cells). (C) Annexin-V/propidium iodide (PI) assay after 48-hour TGFβ treatment. Upper panel, raw FACS data. Upper right box drawn on each plot corresponds to apoptotic cell population (cells positive for both annexin-V and PI). Lower panel, quantification of apoptotic cells in upper right boxes drawn on plots above. For (A–C), representative experiment performed in triplicate (means ± standard deviation) is shown. (D) RT-qPCR of proapoptotic Bmf (BCL2-modifying factor) marker. Cells were treated (or not) with TGFβ ± TβRI inhibitor (SB431542) for 48 hours. For each condition, mRNA level is represented as mean ± standard deviation of 1 representative experiment performed in triplicate.
Figure 3
Figure 3
KRASG12Dand TGFβ cooperate to activate dedifferentiation of AR42J rat acinar cells. (A) High-magnification microscopy of rat acinar cells (AR42J). Phase-contrast microscopy of AR42J-WT and AR42J-KRASG12D cells treated or not with TGFβ for 48 hours. NT, untreated. Scale bars, 100 μm. (B) RT-qPCR of acinar (Ela-1, Cpa1, Mist1), progenitor (Hnf1β, Hes1), and ductal (Sox9) markers after 48-hour TGFβ treatment. For each condition, expression is represented as mean ± standard deviation of at least 3 independent experiments. Statistical analyses were performed by using Mann-Whitney test: *P < .05, **P < .01, ***P < .001. Non-significant (ns) if P > .05. (C) Signaling pathways involved in TGFβ-induced Hnf1β mRNA activation. AR42J-WT cells were cultured in presence of TGFβ along with different kinase inhibitors (inh) of canonical and non-canonical TGFβ pathways: TβRI inh, SB431542; MEK inh, U0126 monoethanolate; JNK inh, JNK-IN-8; P38 inh, SB203580; PI3K inh, LY294002. Hnf1β mRNA was detected by RT-qPCR after 48-hour treatment. For each condition, folds are represented as mean ± standard deviation of at least 3 independent experiments. Statistical analyses were performed by using Mann-Whitney U test: **P < .01. Nonsignificant (ns) if P > .05.
Figure 4
Figure 4
Early activation of TβRICAduring mouse development is embryonically lethal. [E2A-Cre+/+] or [E2A-Cre+/-] mice were crossed with [LSL-TβRICA] (R) mice. Total number of litters, pups, and offspring genotype distribution are presented. Fisher’s exact test was performed to statistically confirm absence of [E2A-Cre+/-; LSL-TβRICA] mice. Nonsignificant (ns), P > .05; *P < .05.
Figure 5
Figure 5
Expression of TβRICAin mouse embryo compromises development of acinar compartment. (A) Breeding strategy to target TβRICA expression in whole adult body by using tamoxifen-inducible Rosa26-CreERT2 allele. (B) Overall survival (Kaplan-Meier analysis) of wild-type (WT) and [Rosa26-CreERT2; LSL-TβRICA] mice after tamoxifen injection. Log-rank (Mantel-Cox) test. **P = .0047. (C) Histology of pancreata prepared from WT and [Rosa26-CreERT2; LSL-TβRICA] mice 5 days after tamoxifen injection. White arrows, apoptotic cells. Scale bars, 200 μm. (D) Breeding strategy to target TβRICA expression in all epithelial pancreatic lineages from embryonic day 8.5 (E8.5) by using Pdx1-Cre allele. (E) Histology of pancreata prepared from WT and [Pdx1-Cre; LSL-TβRICA] (CR) E19.5 embryos. Scale bars, 200 μm. mag, magnification; TAM, tamoxifen.
Figure 6
Figure 6
Inducible TβRICAexpression in pancreatic acinar cells after birth results in SMAD pathway activation in vivo. (A) Breeding strategy to express TβRICA after birth in pancreatic acinar cells by using tamoxifen-inducible Pft1a-CreERT2 allele. Black arrows represent genotyping primers. Sizes of expected fragments are shown. (B) PCR on genomic DNA to assess excision of STOP signal in CERR pancreas after tamoxifen injection. (C) RT-qPCR of TβRICA and Serpine-1 on total RNA from pancreata prepared from mice treated with tamoxifen. Expression level in R mice was arbitrarily set at 1 (mean ± standard deviation; 2 independent experiments). (D) Immunoprecipitation of SMAD2/3 and Western blot analysis of P-SMAD2 (phospho-SMAD2) and total SMAD2. Total lysate was assessed for β-tubulin and SMAD2. (E) RNAscope detection of TβRICA and Smad7 mRNA on pancreatic sections from WT and CERR mice. Scale bars, 100 μm. (A–E): WT, wild-type; R, [LSL-TβRICA]; CERR, [Pft1a-CreERT2; LSL-TβRICA]. mag, magnification; TAM, tamoxifen.
Figure 7
Figure 7
TβRICAexpression in acinar cells induces apoptosis and ductal-like differentiation 3 days after induction. (A) Diagram of experimental design for 5-week-old mice injected with tamoxifen and euthanized 3 days later. (B) H&E staining, TUNEL assay, and immunofluorescence of amylase, CK19, and SOX9. Black arrowheads, apoptotic cells; white arrowheads, CK19/amylase and SOX9/amylase double-positive cells; WT, wild-type; [Pft1a-CreERT-; LSL-TβRICA], CERR; [Pft1a-CreERT2; LSL-KrasG12D], CERK; [Pft1a-CreERT2; LSL-TβRICA; LSL-KrasG12D], CERKR. TAM, tamoxifen. Scale bars, 50 μm.
Figure 8
Figure 8
TβRICAexpression in acinar cells leads to regenerative ADM 3 weeks after induction. (A) Diagram of experimental design for 5-week-old mice injected with tamoxifen and euthanized 3 weeks later. (B) H&E staining and immunofluorescence of amylase and CK19. WT, wild-type; [Pft1a-CreERT-; LSL-TβRICA], CERR; [Pft1a-CreERT2; LSL-KrasG12D], CERK; [Pft1a-CreERT2; LSL-TβRICA; LSL-KrasG12D], CERKR. TAM, tamoxifen. Scale bars, 100 μm.
Figure 9
Figure 9
TβRICAexpression in acinar cells accelerates KRASG12D-induced tumorigenesis several months after induction. (A) Diagram of experimental design representing 5-week-old mice injected with tamoxifen and euthanized 2 or 6 months later. (B) H&E staining. WT, wild-type; [Pft1a-CreERT-; LSL-TβRICA], CERR; [Pft1a-CreERT2; LSL-KrasG12D], CERK; [Pft1a-CreERT2; LSL-TβRICA; LSL-KrasG12D], CERKR. Scale bars, 100 μm. (C) Quantification of pancreatic epithelial lesions at different grades and observed in CERK and CERKR pancreata 2 months and 6 months after TAM injection. TAM, tamoxifen.
Figure 10
Figure 10
KRASG12Dand TGFβ activation cooperate to accelerate pancreatic tumorigenesis without affecting endocrine compartment. Immunohistochemical detection of CK19 and INSULIN in mice of indicated genotypes 2 and 6 months after tamoxifen induction. [Pft1a-CreERT2; LSL-TβRICA] (CERR); [Pft1a-CreERT2; LSL-KrasG12D] (CERK); [Pft1a-CreERT2; LSL-TβRICA; LSL-KrasG12D] (CERKR). Scale bars, 200 μm.
Figure 11
Figure 11
Schematic diagram showing effect of TGFβ signaling activation (alone or in combination with KRASG12D) on pancreatic acinar compartment. A few days after tamoxifen induction, TβRICA induces acinar cell apoptosis and subsequent regenerative metaplasia (ADM). In aging mice, ADM is overcome and replaced by AFI. KRASG12D activation alone induces ADM and PanINs several months after induction. When TβRICA and KRASG12D are simultaneously induced, PanINs develop much earlier. In the context of TβRICA-induced ADM, KRASG12D induces regenerative cells to undergo the ADM>ADR>PanIN sequence (ADR, acinar-to-ductal reprogramming). Hence, TGFβ signaling activation enhances the properties of KRASG12D through its capacity to prime a suitable surrounding for transformation. TAM, tamoxifen. [Pft1a-CreERT-; LSL-TβRICA], CERR; [Pft1a-CreERT2; LSL-KrasG12D], CERK; [Pft1a-CreERT2; LSL-TβRICA; LSL-KrasG12D], CERKR. TAM, tamoxifen. WT, wild-type.

References

    1. Puri S., Folias A.E., Hebrok M. Plasticity and dedifferentiation within the pancreas: development, homeostasis, and disease. Cell Stem Cell. 2015;16:18–31. - PMC - PubMed
    1. Jorgensen M.C., Ahnfelt-Ronne J., Hald J., Madsen O.D., Serup P., Hecksher-Sorensen J. An illustrated review of early pancreas development in the mouse. Endocr Rev. 2007;28:685–705. - PubMed
    1. Shih H.P., Wang A., Sander M. Pancreas organogenesis: from lineage determination to morphogenesis. Annu Rev Cell Dev Biol. 2013;29:81–105. - PubMed
    1. Pan F.C., Wright C. Pancreas organogenesis: from bud to plexus to gland. Dev Dyn. 2011;240:530–565. - PubMed
    1. Pan F.C., Bankaitis E.D., Boyer D., Xu X., van de Casteele M., Magnuson M.A., Heimberg H., Wright C.V. Spatiotemporal patterns of multipotentiality in Ptf1a-expressing cells during pancreas organogenesis and injury-induced facultative restoration. Development. 2013;140:751–764. - PMC - PubMed