Observational Study
. 2020 Dec;69(12):2131-2142.
doi: 10.1136/gutjnl-2019-319766. Epub 2020 Apr 2.

Aberrant gut microbiota alters host metabolome and impacts renal failure in humans and rodents

Affiliations
Observational Study

Aberrant gut microbiota alters host metabolome and impacts renal failure in humans and rodents

Xifan Wang et al. Gut. 2020 Dec.

Abstract

Objective: Patients with renal failure suffer from symptoms caused by uraemic toxins, possibly of gut microbial origin, as deduced from studies in animals. The aim of the study is to characterise relationships between the intestinal microbiome composition, uraemic toxins and renal failure symptoms in human end-stage renal disease (ESRD).

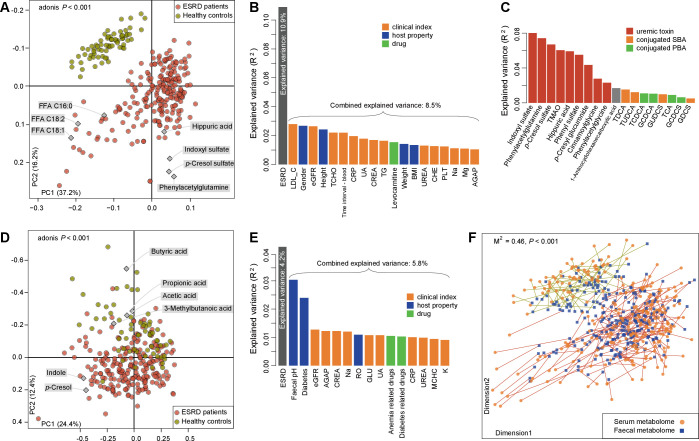
Design: Characterisation of gut microbiome, serum and faecal metabolome and human phenotypes in a cohort of 223 patients with ESRD and 69 healthy controls. Multidimensional data integration to reveal links between these datasets and the use of chronic kidney disease (CKD) rodent models to test the effects of intestinal microbiome on toxin accumulation and disease severity.

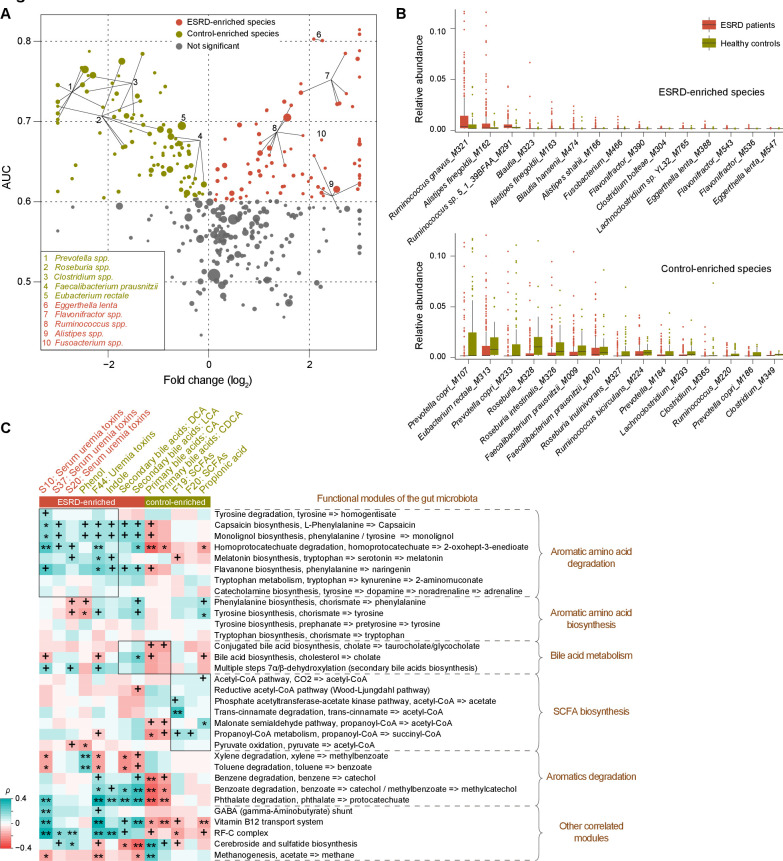
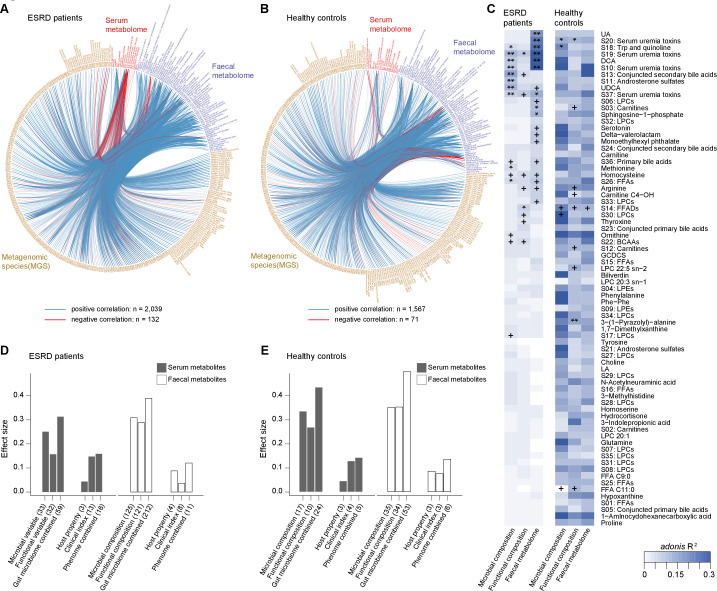
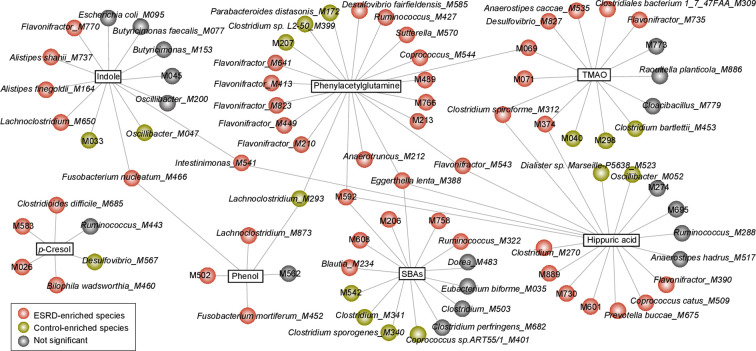
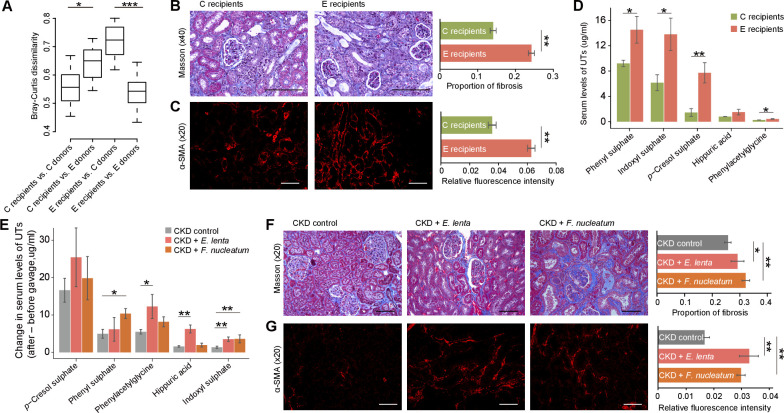
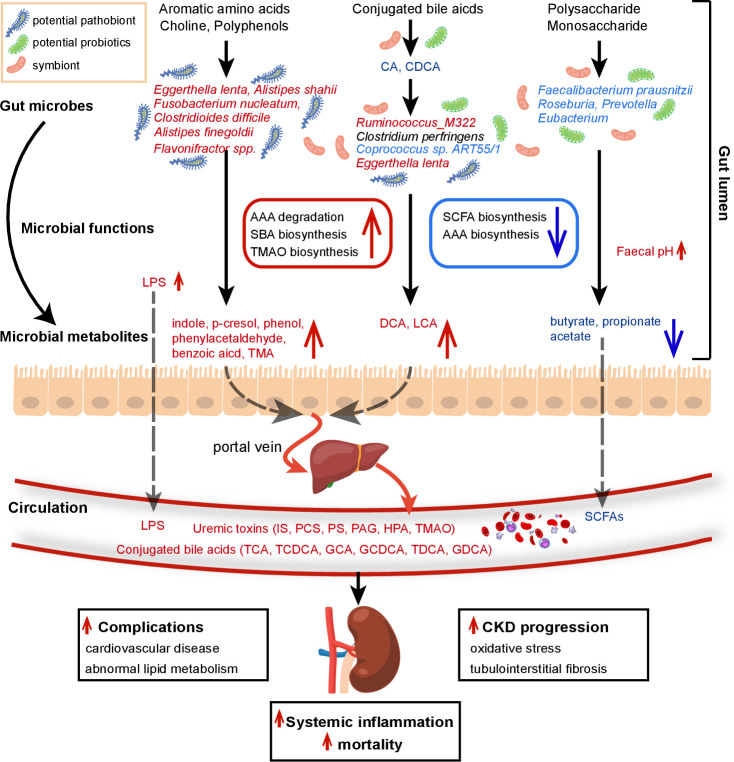
Results: A group of microbial species enriched in ESRD correlates tightly to patient clinical variables and encode functions involved in toxin and secondary bile acids synthesis; the relative abundance of the microbial functions correlates with the serum or faecal concentrations of these metabolites. Microbiota from patients transplanted to renal injured germ-free mice or antibiotic-treated rats induce higher production of serum uraemic toxins and aggravated renal fibrosis and oxidative stress more than microbiota from controls. Two of the species, Eggerthella lenta and Fusobacterium nucleatum, increase uraemic toxins production and promote renal disease development in a CKD rat model. A probiotic Bifidobacterium animalis decreases abundance of these species, reduces levels of toxins and the severity of the disease in rats.

Conclusion: Aberrant gut microbiota in patients with ESRD sculpts a detrimental metabolome aggravating clinical outcomes, suggesting that the gut microbiota will be a promising target for diminishing uraemic toxicity in those patients.

Trial registration number: This study was registered at ClinicalTrials.gov (NCT03010696).

Keywords: bile acid; enteric bacterial microflora.


Conflict of interest statement

Competing interests: None declared.

Figures

Figure 1
Figure 1
Distinct serum and faecal microbiome features associated with patients with ESRD. (A) Separation of serum metabolome between patients with ESRD and healthy controls, revealed by principal component analysis (PCA). The metabolites identified as the major contributors to the separation are indicated by diamonds. (B) Effect size of phenotype indexes that contribute significantly to the variance (R2) of the serum metabolome (adonis p<0.05). This analysis was based on all subjects including patients with ESRD (n=223) and healthy controls (n=69). (C) Effect size of serum metabolites that drive the variance of serum metabolome. (D) Separation of faecal metabolome between patients with ESRD and healthy controls revealed by PCA. (E) Effect size of phenotype indexes which contribute significantly to the variance (R2) of the faecal metabolome (adonis p<0.05). (F) Procrustes analysis of serum microbiome versus faecal microbiome. serum and faecal samples are shown as orange circles and blue squares, respectively; serum and faecal samples from the same individual are connected by red (patients with ESRD) and cyan (healthy controls) lines. AGAP, anioin gap; BMI, body mass index; CHE, cholinesterase; CREA, creatinine; CRP, C reactive protein; eGFR, estimated glomerular filtration rate; ESRD, end-stage renal disease; FFA, free fatty acids; LDL, low density lipids; PBA, primary bile acids; PLT, platelet; SBA, secondary bile acids; TCHO, total Cholesterol; TG, triglycerides; UA, uric acid.
Figure 2
Figure 2
Characterisation of ESRD microbiome and its correlation with altered metabolites in serum and faeces of patients with ESRD. (A) Gut microbiota signatures in patients with ESRD. The X-axis shows the ratio (log2 transformed) of a species abundance in ESRD patients compared with healthy controls. The Y-axis shows the power of a species to stratify patients and healthy controls, expressed as area under the curve (AUC). Species with significant differences in abundance between the two cohorts are shown in red (ESRD enriched) and green (control enriched). Species belonging to the same genus are linked by lines. (B) The boxplot shows the prominent species that differ significantly in abundance between patients with ESRD and healthy controls. boxes represent the interqurtile range between the first and third quartiles and median (internal line). Whiskers denote the lowest and highest values within 1.5 times the range of the first and third quartiles, respectively, and circles represent outliers beyond the whiskers. (C) Correlation of the concentrations of ESRD-enriched and healthy control-enriched metabolites with microbial functions. The heatmap shows the Spearman correlation coefficients between functional modules and serum (red text, showing uraemic toxins) or faecal (green text, showing uraemic toxin precursors, bile acids and SCFAs) metabolite clusters. Black boxes highlight the ESRD-associated metabolites and their corresponding functional modules. The significance level in the correlation test is denoted as: +q<0.05; *q<0.01; **q<0.001. ESRD, end-stage renal disease; CoA, coenzyme A; GABA, gamma amino butyric acid; RF-C, replication factor C; SCFA, short chain amino acids.
Figure 3
Figure 3
The gut microbiome influences host serum and faecal metabolomes in patients with ESRD. (A–B) The interomics correlation networks of all variables for the gut microbiome, serum and faecal metabolomes of patients with ESRD and healthy controls. Vertices indicate omics variables, and lines indicate a significant Spearman correlation coefficient at |ρ|>0.35 and q<0.01. (C) The permutational multivariate analysis of variance (PERMANOVA) of the covariant relationship between each serum metabolite cluster and the gut microbiome (including microbial and functional compositions) or faecal metabolome. The effect sizes between serum metabolite clusters and the gut or faecal metabolome are represented in shades of blue. Significance level: ‘+’, permutated p<0.05; ‘*’, permutated p<0.01; ‘**’, permutated p<0.001. (D–E) The proportions of total variation in serum and faecal metabolomes of patients with ESRD (D) and healthy controls (E) explained by the gut microbiome and host phenome. To calculate the effect size, a set of non-redundant covariates was selected from the gut microbiome (including microbial and functional variables) or host phenome (including host properties and clinical indexes) by stepwise PERMANOVA analysis. The number of non-redundant covariates is shown in brackets. The detailed information for such covariates is provided in online supplementary table 11. ESRD, end-stage renal disease.
Figure 4
Figure 4
Alteration of the gut microbial composition in patients with ESRD contributes to uraemic toxin production and secondary bile acid biosynthesis. Network view of uraemic toxins/SBAs and MGSs. squares represent the uraemic toxins or SBAs, and the surrounding connected circles represent the species that were used in the random forest models. ESRD, end-stage renal disease; MGSs, metagenomic species; SBAs, secondary bile acids; TMAO, trimethylamine N-oxide.
Figure 5
Figure 5
Animal experiments validate the role of ESRD microbiota and two species, Eggerthella lenta and Fusobacterium nucleatum, in producing serum uraemic toxins and aggravating renal disease development. (A) Bray-Curtis dissimilarity between recipients and donors. compositions of gut microbial taxa of ESRD donors (pool of n=13), control donors (pool of n=13), ESRD-microbiota recipients (abbreviated as E recipients, n=6) and control-microbiota recipients (abbreviated as C recipients, n=6) were determined by 16S rRNA sequencing. (B) Masson’s trichrome staining and quantification of the proportion of the fibrotic area in the renal cortex of recipient mice after faecal transplantation for 2 weeks. (C) Immunofluorescence of α-SMA and quantification of the relative fluorescence intensity of the α-SMA+ area in renal tubular of recipient mice after faecal transplantation for 2 weeks. (D) Concentration of serum uraemic toxin levels in recipient mice after faecal transplantation for 2 weeks. (E) Changes of serum uraemic toxin levels in CKD rats after 8 weeks gavage-feeding E. lenta or F. nucleatum. for (D, E), the serum concentrations of phenylacetylglycine (a major adduct of phenylacetate in rodents) were evaluated in mice and rats. (F) Masson’s trichrome staining and quantification of the proportion of the fibrotic area in the renal cortex of CKD rats after 8 week gavage-feeding E. lenta or F. nucleatum. (G) Immunofluorescence of α-SMA and quantification of the relative fluorescence intensity of the α-SMA+ area in renal tubular of CKD rats after 8 weeks gavage-feeding E. lenta or F. nucleatum. Data are shown as mean±s.e.m. *p<0.05; **p<0.01. CKD, chronic kidney disease; ESRD, end-stage renal disease.
Figure 6
Figure 6
Proposed mechanism of ESRD aggravation by the altered gut microbiome. schematic summary illustrating the flux of metabolites from gut microbiota to faeces and then to serum, affecting the clinical status of the patient. ESRD-enriched and depleted microbial species, functions and faecal/serum metabolites are labelled in red and blue, respectively. The enrichment of species such as Eggerthella lenta, Fusobacterium nucleatum and Alistipes shahii lead to increased AAA degradation, SBA and TMAO biosynthesis in the gut, resulting in higher levels of uraemic toxins and SBAs in faeces and blood of patients with ESRD. Simultaneously, the depletion of species such as Faecalibacterium prausnitzii, Roseburia and Prevotella lead to decreased gut microbial SCFA biosynthesis. Such gut microbiota-driven adverse metabolism may aggravate CKD progression, induce complications and systemic inflammation, and increase mortality of patients with ESRD. AAA, aromatic amino acid; ESRD, end-stage renal disease; SBA, secondary bile acid; SCFA, short chain fatty acid; TMAO, trimethylamine N-oxide.

Similar articles

Cited by

References

    1. Webster AC, Nagler EV, Morton RL, et al. . Chronic kidney disease. The Lancet 2017;389:1238–52. 10.1016/S0140-6736(16)32064-5 - DOI - PubMed
    1. Zhang L, Wang F, Wang L, et al. . Prevalence of chronic kidney disease in China: a cross-sectional survey. The Lancet 2012;379:815–22. 10.1016/S0140-6736(12)60033-6 - DOI - PubMed
    1. Liyanage T, Ninomiya T, Jha V, et al. . Worldwide access to treatment for end-stage kidney disease: a systematic review. Lancet 2015;385:1975–82. 10.1016/S0140-6736(14)61601-9 - DOI - PubMed
    1. Us renal data system 2017 annual data report: epidemiology of kidney disease in the United States. AJKD 2017;71:A7. - PMC - PubMed
    1. Meyer TW, Hostetter TH. Uremia. N Engl J Med 2007;357:1316–25. 10.1056/NEJMra071313 - DOI - PubMed

Publication types

Associated data