

Wastewater surveillance of SARS-CoV-2 from aircraft to citywide monitoring
- PMID: 40456842
- PMCID: PMC12130461
- DOI: 10.1038/s41467-025-60490-1
Wastewater surveillance of SARS-CoV-2 from aircraft to citywide monitoring
Abstract
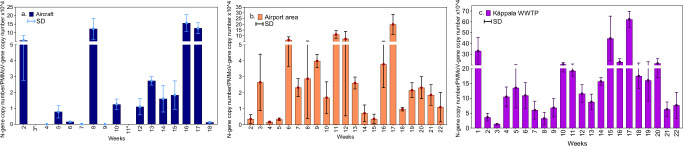
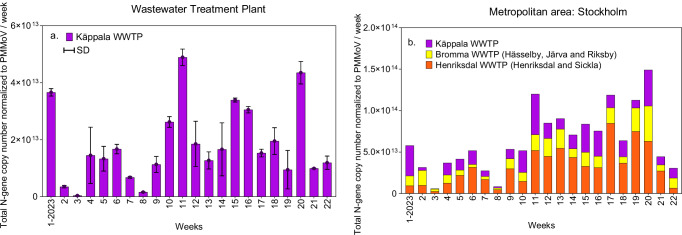
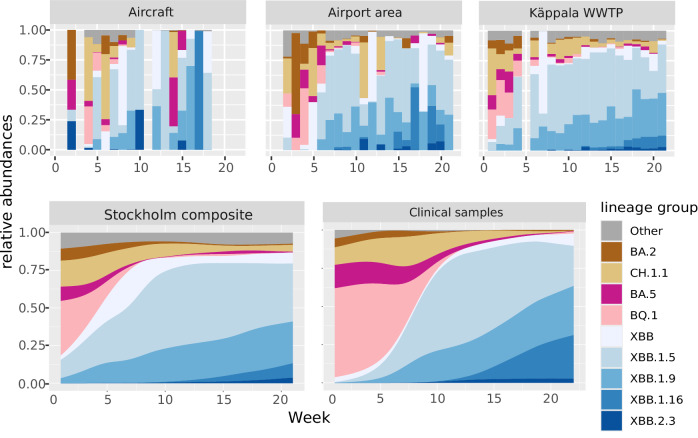
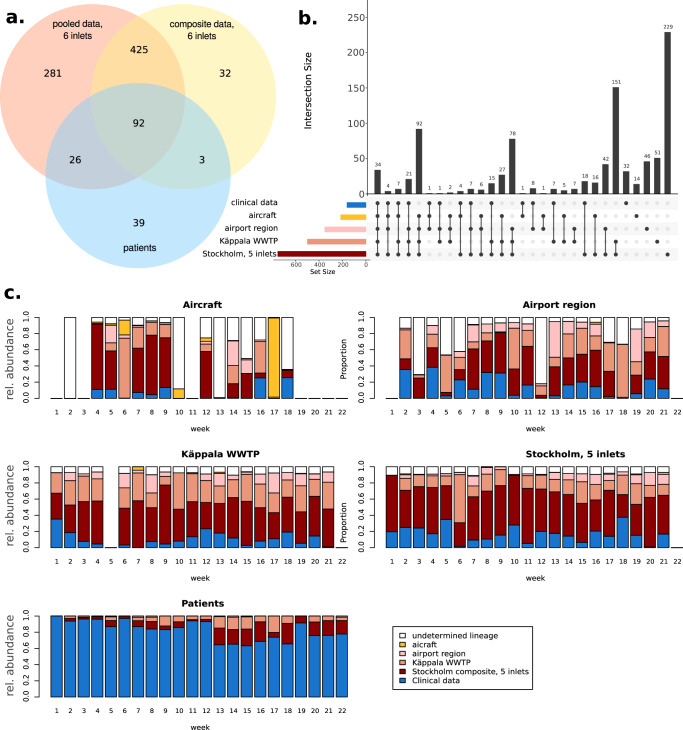
Wastewater monitoring is highly efficient in SARS-CoV-2 surveillance for tracking virus spread through travel, surpassing traditional airport passenger testing. This study explored the links between SARS-CoV-2 contents and variants from aircraft to city, assessing the impact of detected variants from international travellers versus the local population. A total of 969 variants using next-generation sequencing (NGS) were examined to understand the links between-aircraft, Arlanda airport, wastewater treatment plants (WWTPs), and Stockholm city-and compared these to variants detected in Stockholm hospitals from January to May 2023. SARS-CoV-2 contents in WWTPs reflected local infection rates, requiring analysis from multiple plants for an accurate city-wide infection assessment. Variants initially detected in aircraft arriving from China did not spread widely during the study period. RT-qPCR is adequate for the detection of specific variants in wastewater, including Variants Under Monitoring. However, NGS remains a powerful method for identifying novel variants. Wastewater monitoring was more effective than clinical testing in the early detection of specific variants, with notable delays observed in clinical surveillance. Furthermore, a broad range of variants are detected in wastewater that surpasses clinical tests. This underscores the vital role of wastewater-based epidemiology in managing future outbreaks and enhancing global health security.
© 2025. The Author(s).
Conflict of interest statement
Competing interests: The authors declare no competing interests.
Figures
Similar articles
-
Usefulness of aircraft and airport wastewater for monitoring multiple pathogens including SARS-CoV-2 variants.J Travel Med. 2024 Jul 7;31(5):taae074. doi: 10.1093/jtm/taae074. J Travel Med. 2024. PMID: 38813965
-
Long-term wastewater monitoring of SARS-CoV-2 viral loads and variants at the major international passenger hub Amsterdam Schiphol Airport: A valuable addition to COVID-19 surveillance.Sci Total Environ. 2024 Aug 10;937:173535. doi: 10.1016/j.scitotenv.2024.173535. Epub 2024 May 25. Sci Total Environ. 2024. PMID: 38802021
-
Notes from the Field: Aircraft Wastewater Surveillance for Early Detection of SARS-CoV-2 Variants - John F. Kennedy International Airport, New York City, August-September 2022.MMWR Morb Mortal Wkly Rep. 2023 Feb 24;72(8):210-211. doi: 10.15585/mmwr.mm7208a3. MMWR Morb Mortal Wkly Rep. 2023. PMID: 36821716 Free PMC article. No abstract available.
-
Establishing a European wastewater pathogen monitoring network employing aviation samples: a proof of concept.Hum Genomics. 2025 Mar 11;19(1):24. doi: 10.1186/s40246-025-00725-w. Hum Genomics. 2025. PMID: 40069832 Free PMC article. Review.
-
A global aircraft-based wastewater genomic surveillance network for early warning of future pandemics.Lancet Glob Health. 2023 May;11(5):e791-e795. doi: 10.1016/S2214-109X(23)00129-8. Lancet Glob Health. 2023. PMID: 37061316 Free PMC article. Review.
References
-
- World Health Organization (WHO). Novel Coronavirus (2019-nCoV) Situation Report - 1. https://www.who.int/docs/default-source/coronaviruse/situation-reports/2... (2020).
-
- World Health Organization (WHO). Statement on the update of WHO’s working definitions and tracking system for SARS-CoV-2 variants of concern and variants of interest. https://www.who.int/news/item/16-03-2023-statement-on-the-update-of-who-... (2023). - PMC - PubMed
-
- US-CDC. Traveler-based genomic surveillance for early detection of new SARS-CoV-2 variants. https://wwwnc.cdc.gov/travel/page/travel-genomic-surveillance (2023).
MeSH terms
Substances
Grants and funding
- 05204-2022/Folkhälsomyndigheten (Public Health Agency of Sweden)
- S2022/04841/Folkhälsomyndigheten (Public Health Agency of Sweden)
- 05204-2022/Folkhälsomyndigheten (Public Health Agency of Sweden)
- S2022/04841/Folkhälsomyndigheten (Public Health Agency of Sweden)
- 05204-2022/Folkhälsomyndigheten (Public Health Agency of Sweden)
- S2022/04841/Folkhälsomyndigheten (Public Health Agency of Sweden)
- 05204-2022/Folkhälsomyndigheten (Public Health Agency of Sweden)
- S2022/04841/Folkhälsomyndigheten (Public Health Agency of Sweden)
- 05204-2022/Folkhälsomyndigheten (Public Health Agency of Sweden)
- S2022/04841/Folkhälsomyndigheten (Public Health Agency of Sweden)
- 05204-2022/Folkhälsomyndigheten (Public Health Agency of Sweden)
LinkOut - more resources
Full Text Sources
Medical
Miscellaneous
