

A real-time spatio-temporal syndromic surveillance system with application to small companion animals
- PMID: 31780686
- PMCID: PMC6882870
- DOI: 10.1038/s41598-019-53352-6
A real-time spatio-temporal syndromic surveillance system with application to small companion animals
Abstract
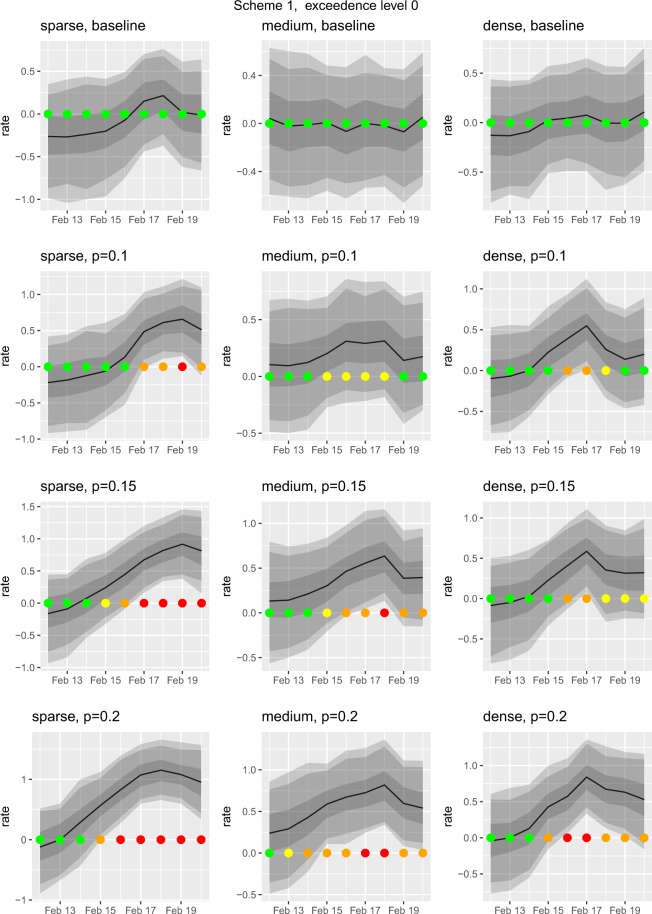
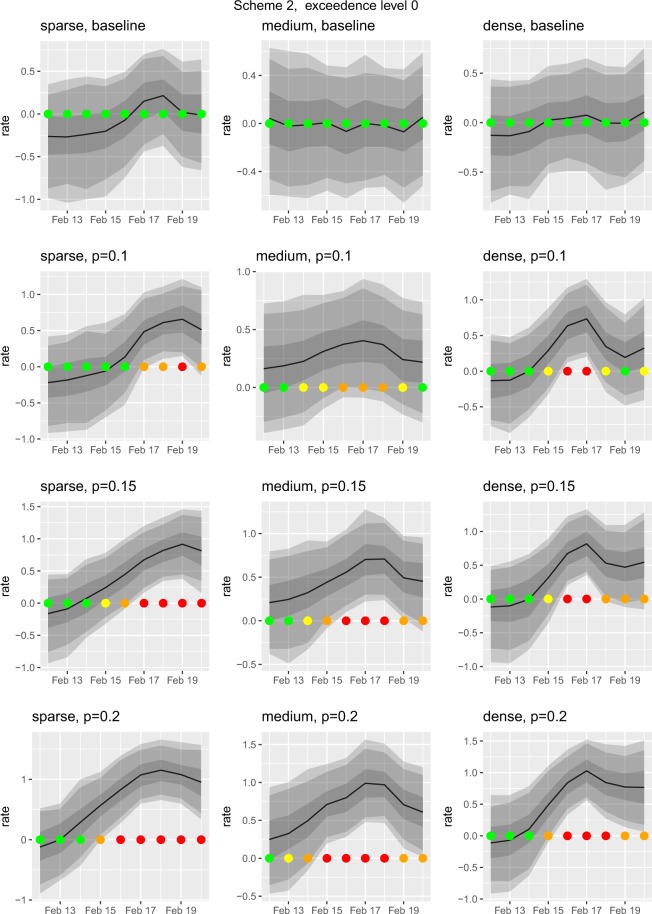
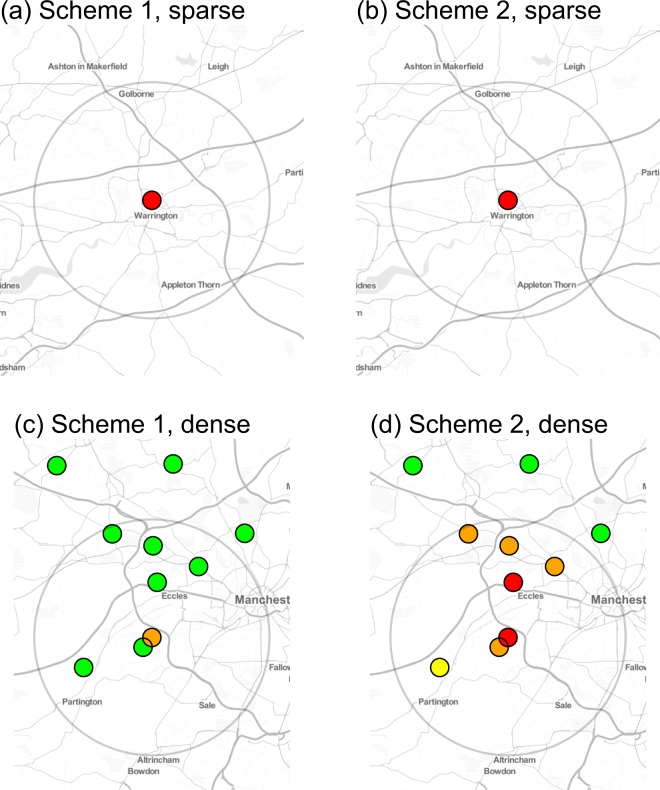
Lack of disease surveillance in small companion animals worldwide has contributed to a deficit in our ability to detect and respond to outbreaks. In this paper we describe the first real-time syndromic surveillance system that conducts integrated spatio-temporal analysis of data from a national network of veterinary premises for the early detection of disease outbreaks in small animals. We illustrate the system's performance using data relating to gastrointestinal disease in dogs and cats. The data consist of approximately one million electronic health records for dogs and cats, collected from 458 UK veterinary premises between March 2014 and 2016. For this illustration, the system predicts the relative reporting rate of gastrointestinal disease amongst all presentations, and updates its predictions as new data accrue. The system was able to detect simulated outbreaks of varying spatial geometry, extent and severity. The system is flexible: it generates outcomes that are easily interpretable; the user can set their own outbreak detection thresholds. The system provides the foundation for prompt detection and control of health threats in companion animals.
Conflict of interest statement
The authors declare no competing interests.
Figures
Similar articles
-
The passive surveillance of ticks using companion animal electronic health records.Epidemiol Infect. 2017 Jul;145(10):2020-2029. doi: 10.1017/S0950268817000826. Epub 2017 May 2. Epidemiol Infect. 2017. PMID: 28462753 Free PMC article.
-
Spatial-temporal clustering of companion animal enteric syndrome: detection and investigation through the use of electronic medical records from participating private practices.Epidemiol Infect. 2015 Sep;143(12):2547-58. doi: 10.1017/S0950268814003574. Epub 2014 Dec 29. Epidemiol Infect. 2015. PMID: 25543461 Free PMC article.
-
Surveillance: pointing the way to improved welfare for companion animals.Vet Rec. 2013 Sep 14;173(10):240-2. doi: 10.1136/vr.f4519. Vet Rec. 2013. PMID: 24038276
-
Disease Risk Assessments Involving Companion Animals: an Overview for 15 Selected Pathogens Taking a European Perspective.J Comp Pathol. 2016 Jul;155(1 Suppl 1):S75-97. doi: 10.1016/j.jcpa.2015.08.003. Epub 2015 Sep 28. J Comp Pathol. 2016. PMID: 26422413 Review.
-
Cancer registration in dogs and cats: A narrative review of history, current status, and standardization efforts.Res Vet Sci. 2025 Aug;191:105673. doi: 10.1016/j.rvsc.2025.105673. Epub 2025 May 2. Res Vet Sci. 2025. PMID: 40339218 Review.
Cited by
-
Setting clinically relevant thresholds for the notification of canine disease outbreaks to veterinary practitioners: an exploratory qualitative interview study.Front Vet Sci. 2024 Feb 28;11:1259021. doi: 10.3389/fvets.2024.1259021. eCollection 2024. Front Vet Sci. 2024. PMID: 38482169 Free PMC article.
-
Evaluation of a novel syndromic surveillance system for the detection of the 2007 melamine-related nephrotoxicosis foodborne outbreak in dogs and cats in the United States.PeerJ. 2020 May 7;8:e9093. doi: 10.7717/peerj.9093. eCollection 2020. PeerJ. 2020. PMID: 32419988 Free PMC article.
-
Using topic modelling for unsupervised annotation of electronic health records to identify an outbreak of disease in UK dogs.PLoS One. 2021 Dec 9;16(12):e0260402. doi: 10.1371/journal.pone.0260402. eCollection 2021. PLoS One. 2021. PMID: 34882714 Free PMC article.
References
-
- Fricker, R. D. Syndromic Surveillance in Encyclopedia of Quantitative Risk Analysis and Assessment (eds Melnick, E.L. & Everitt, B.S.) 1743–1752 (John Wiley and Sons Ltd, 2008).
Publication types
MeSH terms
Grants and funding
LinkOut - more resources
Full Text Sources
Miscellaneous
