Review
. 2020 Sep 7;12(9):2542.
doi: 10.3390/cancers12092542.

Neurotrophin Signaling in Medulloblastoma

Affiliations
Review

Neurotrophin Signaling in Medulloblastoma

Amanda Thomaz et al. Cancers (Basel). .

Abstract

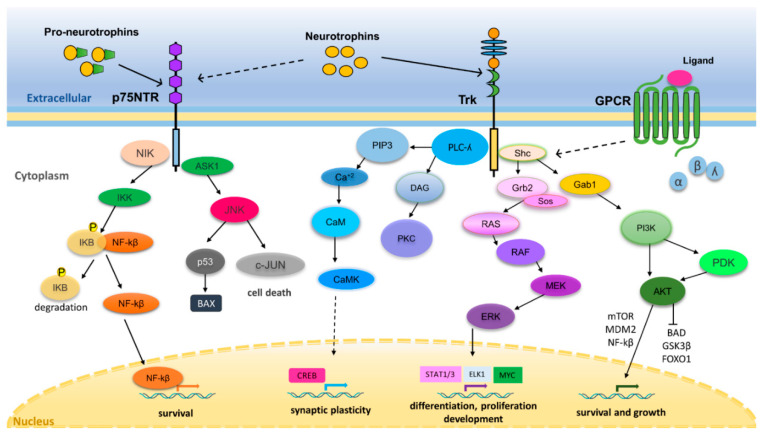
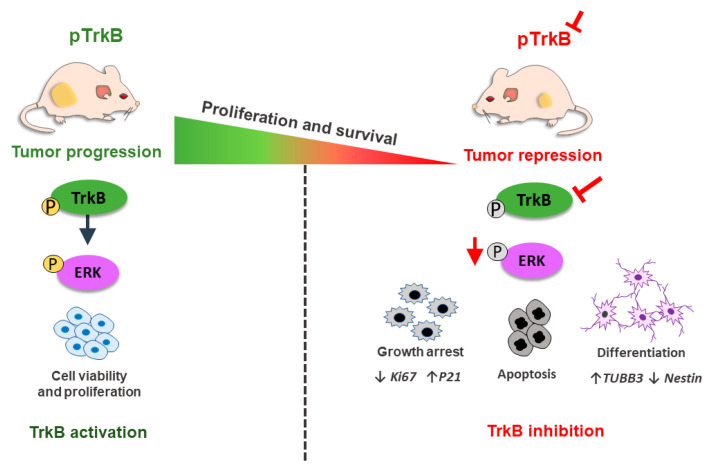
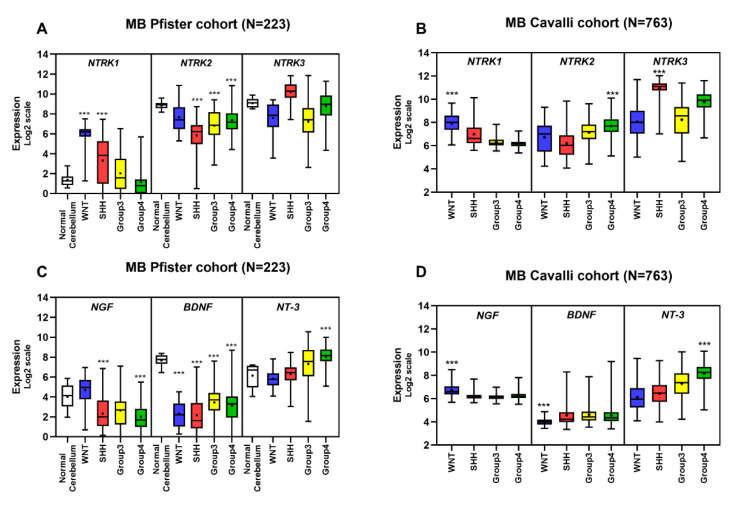
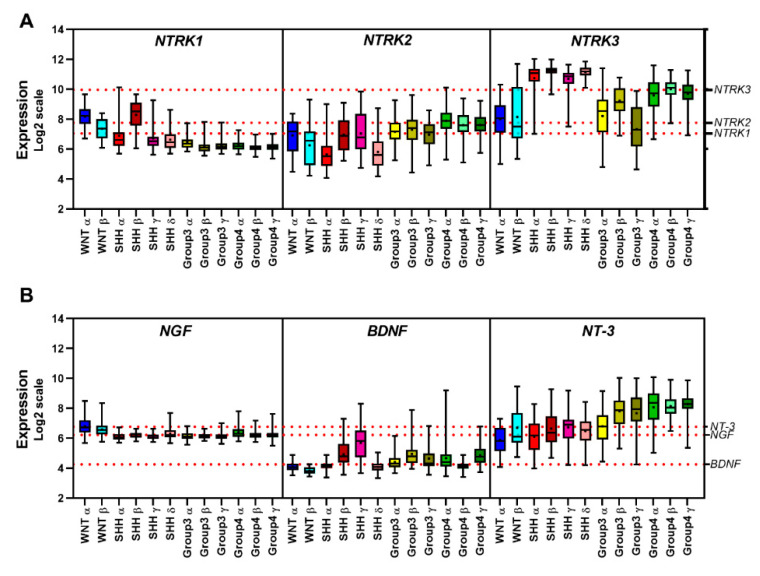
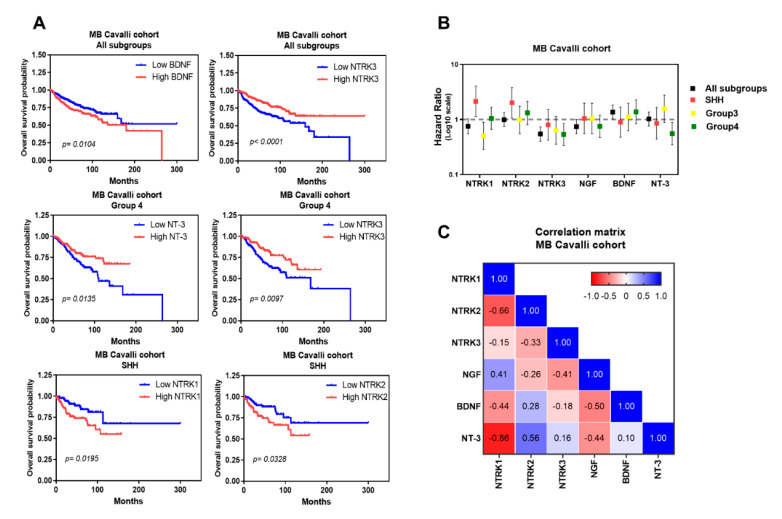
Neurotrophins are a family of secreted proteins that act by binding to tropomyosin receptor kinase (Trk) or p75NTR receptors to regulate nervous system development and plasticity. Increasing evidence indicates that neurotrophins and their receptors in cancer cells play a role in tumor growth and resistance to treatment. In this review, we summarize evidence indicating that neurotrophin signaling influences medulloblastoma (MB), the most common type of malignant brain cancer afflicting children. We discuss the potential of neurotrophin receptors as new therapeutic targets for the treatment of MB. Overall, activation of TrkA and TrkC types of receptors seem to promote cell death, whereas TrkB might stimulate MB growth, and TrkB inhibition displays antitumor effects. Importantly, we show analyses of the gene expression profile of neurotrophins and their receptors in MB primary tumors, which indicate, among other findings, that higher levels of NTRK1 or NTRK2 are associated with reduced overall survival (OS) of patients with SHH MB tumors.

Keywords: brain tumor; brain-derived neurotrophic factor; medulloblastoma; nerve growth factor; neurotrophin; tropomyosin receptor kinase.


Conflict of interest statement

The authors declare that they have no conflict of interest.

Figures

Figure 1
Figure 1
Signaling mechanisms mediating the actions of neurotrophins. Neurotrophin/Trk signaling involves neurotrophin binding to Trks, leading to receptor dimerization, autophosphorylation of tyrosine residues, and the recruitment of cytosolic adaptor proteins such as Src homology collagen protein (Shc). Shc recruits the adaptor growth factor receptor-bound protein 2 (GRB2) which is linked to the Ras exchange factor son of sevenless (SOS) leading to the activation of a RAS- MAPK pathway (RAS-RAF-MEK-ERK). Activated extracellular-regulated kinase (ERK) translocates to the nucleus and transactivates transcription factors such as STAT1/3, Elk1, and Myc, modulating gene expression to induce proliferation, differentiation or development. Shc can also recruit GRB2-associated-binding protein 1 (Gab1), driving activation of the PI3K-PDK1-Akt cascade. Phosphorylated Akt can regulate cell survival, growth, and angiogenesis via activation or inactivation of downstream targets. Akt can play an anti-apoptotic role through inactivation of Forkhead box protein O1 (FOXO1) transcription factor, Bcl-2-associated death promoter (BAD) and glycogen synthesis kinase (GSK-3β). Akt activates several proteins important for cell survival such as mammalian target of rapamycin (mTOR), murine double minute 2 (MDM2) and NF-k β. Phosphorylation of PLCγ by Trk receptors enables catalysis of phosphatidylinositol 4,5-biphosphate (PIP 2) cleavage to diacylglycerol (DAG) and inositol triphosphate (IP 3), which releases calcium from intracellular stores, activating calmodulin (CaM) and Ca2+ /CaM-dependent protein kinases (CaMKs). Together, these signaling molecules stimulate multiple intracellular enzymes that regulate the activity of transcription factors, such as cAMP response element-binding protein (CREB) and ion channels involved in the control of synaptic plasticity. Trk transactivation may be mediated by G protein-couple receptors (GPCRs). GPCR-activated members of c-Src family induce a neurotrophin-independent transactivation of a Trk via trans-phosphorylation of cytosolic tyrosines, which provide docking sites for triggering intracellular signaling cascades like PI3K-PDK1-Akt and MAPK. Binding of neurotrophins to p75NTR can activate either the NF-kB signaling pathway producing prosurvival signals, or c-Jun N-terminal kinase (JNK) signaling to induce cell death. P75NTR can activate the kinase NIK, which in turn stimulates IKK complexes that phosphorylate IKB, leading to its ubiquitination and proteasomal processing and subsequent releasing of NF-kB. This creates transcriptionally competent NF-κB complexes that translocate to the nucleus and induce the expression of survival genes. Neurotrophin binding to p75NTR can also induce activation of apoptosis signal-regulating kinase 1 (ASK1), which, in turn, activates JNK. JNK itself, or via c-JUN phosphorylation, stimulates p53-mediated apoptosis by regulating its targets such as Bcl-2-associated X protein (BAX). Pro-neurotrophins can also bind to p75NTR to initiate cell apoptosis via the JNK signaling pathway [31,33,34,42].
Figure 2
Figure 2
TrkB inhibition decreases proliferation and survival pathways leading to a reduction of tumor growth and increased apoptosis and differentiation features in medulloblastoma (MB) cells. Scheme depicting mouse xenografted with MB cells. In the absence of TrkB antagonist, MB cells continue to grow at high proliferation rates. Treating mice with TrkB antagonist, ANA-12, promotes delay in tumor growth in vivo and cellular changes consistent with growth arrest, apoptosis and differentiation mediated by downregulation of ERK pathway, decreased KI67 and Nestin expression markers and increased expression of p21 and TUBB3 genes (modified from [111]).
Figure 3
Figure 3
Transcript levels of neurotrophins and their receptors in tumors across the 4 MB molecular variants compared to expression in normal human cerebellum. Expression levels were examined in previously described transcriptome data sets comprising samples from Pfister (n = 223 MB samples; [22]), Roth (n = 9 normal cerebellum samples; [11]), and Cavalli et al. [15] (n = 763 MB samples). Expression of NTRKs (A,B) and neurotrophins (C,D) across all samples is presented in boxplot format as log2-transformed signal intensity. All subgroups were compared using a Kruskal–Wallis test followed by the False Discovery Rate method. Data are shown as median and whiskers: min to max. Statistical differences in comparison to normal cerebellum are shown in panels A and C, and differences between all subgroups in panels B and D; *** p ≤ 0.001 for significance.
Figure 4
Figure 4
Transcript levels of neurotrophins and their receptors in tumors across the 12 MB molecular subtypes. Expression levels were examined in previously described transcriptome data set comprising tumor samples from patients in the Cavalli cohort (n = 763 MB samples) [15]. Expression of NTRKs (A) and neurotrophins (B) across all samples is presented in boxplot format as log2-transformed signal intensity. Comparisons among subgroups were performed using a Kruskal–Wallis test followed by the False Discovery Rate method. Data are shown as median and whiskers: min to max; the red dotted line displays the median of expression of each gene according to MB subtype. Sample characteristics and general methods for expression profiling analyses were as described in the legend for Figure 3.
Figure 5
Figure 5
Prognostic value of neurotrophins and their receptors in MB patients. Kaplan–Meier overall survival curve from MB patients according to the expression level neurotrophins and their receptors (A). Kaplan–Meier plot of MB overall survival stratified by the median of expression for each marker in the Cavalli cohort [15] are classified into low or high expression levels. The statistical significance was determined using a log-rank test (p ≤ 0.05). Log of Hazard Ratios of NTRKs and neurotrophins (B). Markers with a hazard ratio smaller than 1.00 represent ‘‘protective markers’’ and those with hazard ratios larger than 1.00 represent ‘‘risk markers’’. (C). Heatmap of the correlation matrix of the NTRKs and neurotrophins in all molecular subgroups from the cohort. The correlation coefficient is colour-coded from red (−1) representing a negative correlation to blue (1) representing a positive correlation. Sample characteristics and general methods for expression profiling analyses were as described in the legend for Figure 3.

References

    1. Shawver L.K., Slamon D., Ullrich A. Smart drugs: Tyrosine kinase inhibitors in cancer therapy. Cancer Cell. 2002;1:117–123. doi: 10.1016/S1535-6108(02)00039-9. - DOI - PubMed
    1. Arora A., Scholar E.M. Role of tyrosine kinase inhibitors in cancer therapy. J. Pharmacol. Exp. Ther. 2005;315:971–979. doi: 10.1124/jpet.105.084145. - DOI - PubMed
    1. Desmet C.J., Peeper D.S. The neurotrophic receptor TrkB: A drug target in anti-cancer therapy? Cell. Mol. Life Sci. 2006;63:755–759. doi: 10.1007/s00018-005-5490-8. - DOI - PMC - PubMed
    1. Thiele C.J., Li Z., McKee A.E. On Trk--the TrkB signal transduction pathway is an increasingly important target in cancer biology. Clin. Cancer Res. 2009;15:5962–5967. doi: 10.1158/1078-0432.CCR-08-0651. - DOI - PMC - PubMed
    1. Roesler R., de Farias C.B., Abujamra A.L., Brunetto A.L., Schwartsmann G. BDNF/TrkB signaling as an anti-tumor target. Expert Rev. Anticancer Ther. 2011;11:1473–1475. doi: 10.1586/era.11.150. - DOI - PubMed

LinkOut - more resources