. 2018 May 23;20(6):393.
doi: 10.3390/e20060393.

Comparison of Compression-Based Measures with Application to the Evolution of Primate Genomes

Affiliations

Comparison of Compression-Based Measures with Application to the Evolution of Primate Genomes

Diogo Pratas et al. Entropy (Basel). .

Abstract

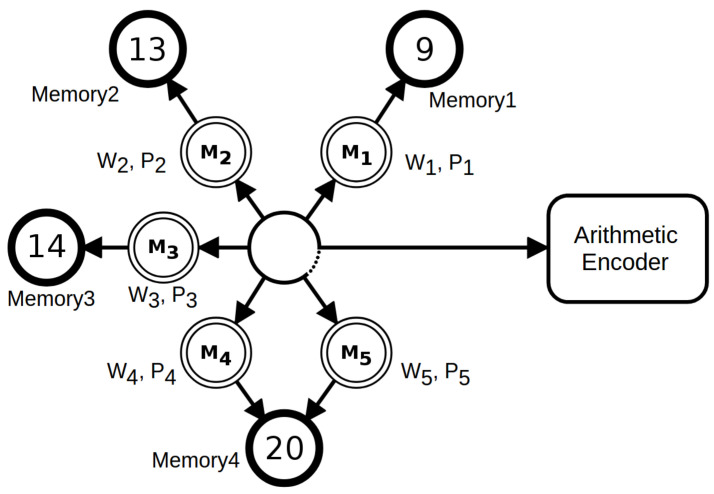
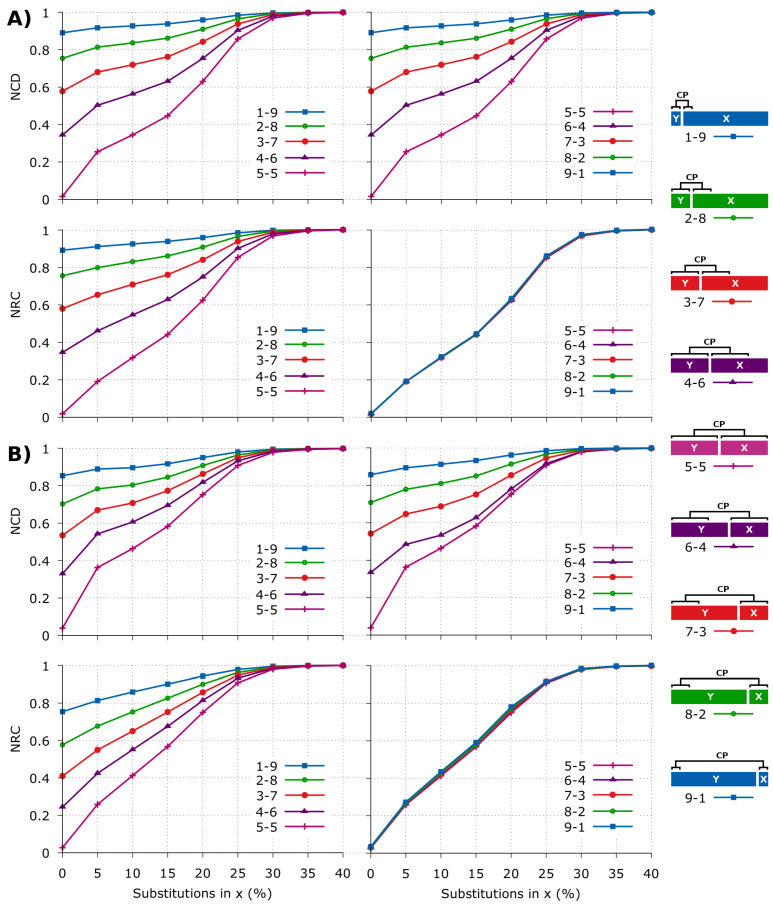
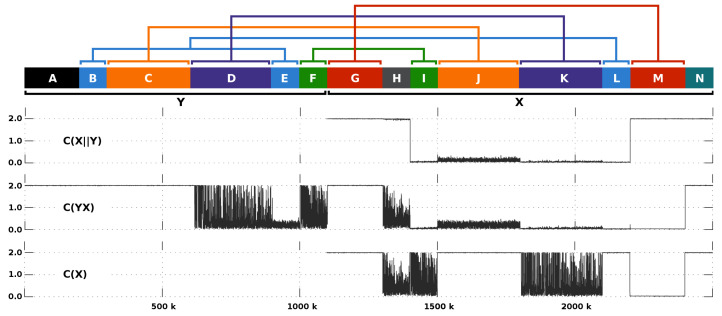
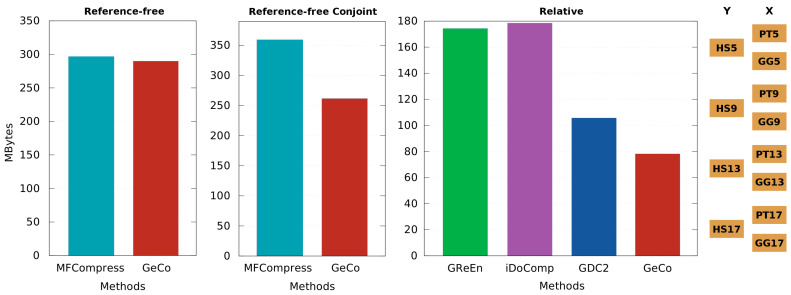
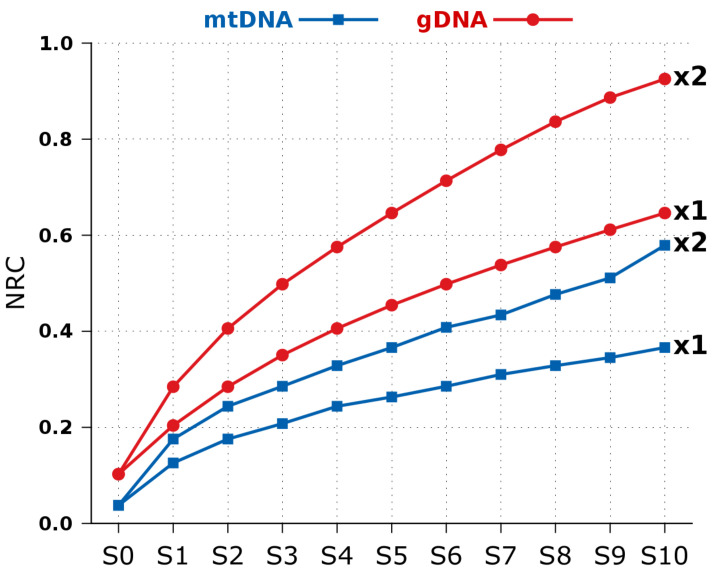
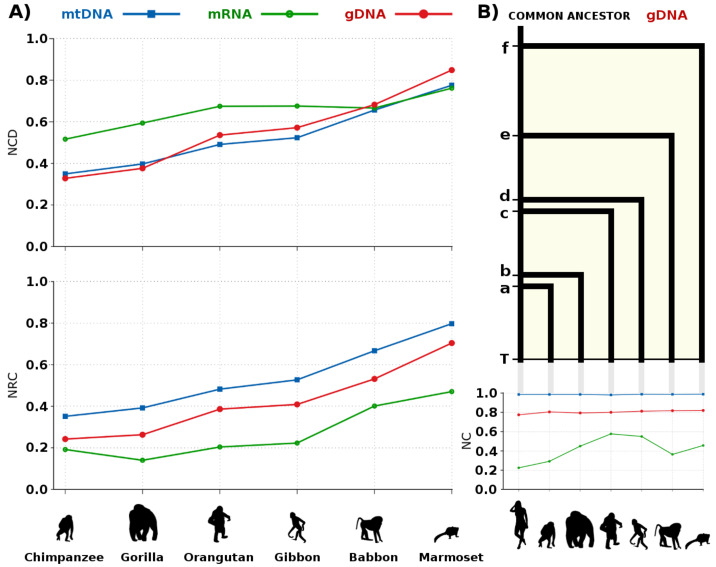
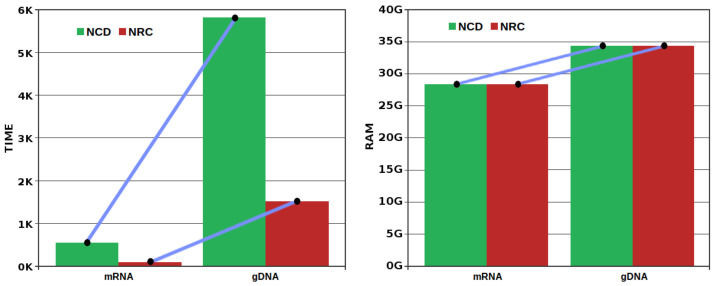
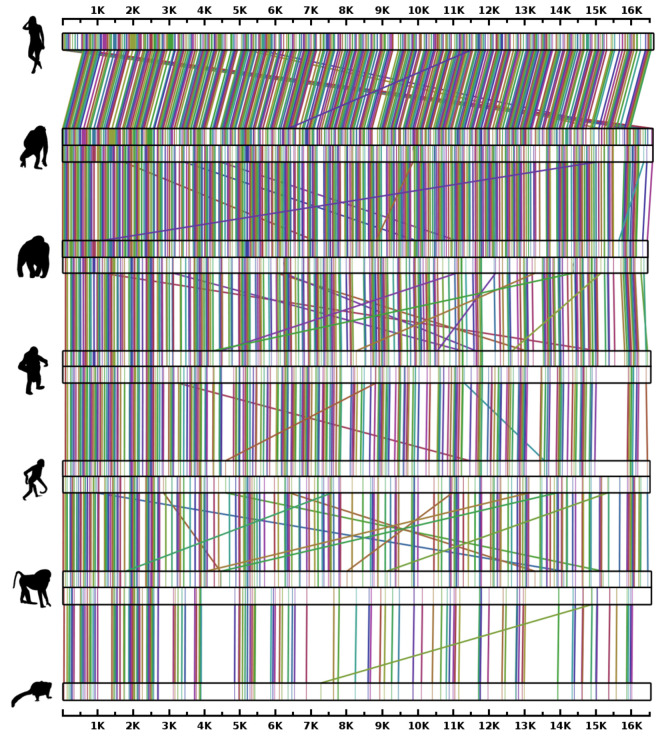
An efficient DNA compressor furnishes an approximation to measure and compare information quantities present in, between and across DNA sequences, regardless of the characteristics of the sources. In this paper, we compare directly two information measures, the Normalized Compression Distance (NCD) and the Normalized Relative Compression (NRC). These measures answer different questions; the NCD measures how similar both strings are (in terms of information content) and the NRC (which, in general, is nonsymmetric) indicates the fraction of one of them that cannot be constructed using information from the other one. This leads to the problem of finding out which measure (or question) is more suitable for the answer we need. For computing both, we use a state of the art DNA sequence compressor that we benchmark with some top compressors in different compression modes. Then, we apply the compressor on DNA sequences with different scales and natures, first using synthetic sequences and then on real DNA sequences. The last include mitochondrial DNA (mtDNA), messenger RNA (mRNA) and genomic DNA (gDNA) of seven primates. We provide several insights into evolutionary acceleration rates at different scales, namely, the observation and confirmation across the whole genomes of a higher variation rate of the mtDNA relative to the gDNA. We also show the importance of relative compression for localizing similar information regions using mtDNA.

Keywords: DNA sequences; NCD; NRC; data compression; primate evolution.


Conflict of interest statement

The authors declare no conflict of interest.

Figures

Figure 1
Figure 1
A mixture of five context models. Each model has a weight (W) and associated probabilities (P) that are calculated according to the respective memory model. The tolerant context model (5) uses the same memory of model 4, since they have the same context (depth 20). After, the probabilities are averaged according to the respective weight and redirected to the arithmetic encoder.
Figure 2
Figure 2
Comparison of the NCD (Equation (3)) and the NRC (Equation (5)) for several synthetic sequences with different substitutions applied on x. The sequences architecture is at right, where “CP” means copy. The substitutions in x are only applied after coping a region of y into x. Each pair, x and y, has a length of 1 MB. (A) the distribution of the sequences is uniform. For replication use the script runComparison.sh; (B) distribution is not uniform, and the sequences contain multiple repeats [105]. The numbers a-b stand for string sizes proportions, for example 1-9 means that y has size 0.1 MB and x 0.9 MB. For replication use runComparisonWithRedundancy.sh.
Figure 3
Figure 3
Comparison of the C(xy) (top profile), the C(yx) (middle profile) and the C(x) (bottom profile) given several types of rearrangements between x and y. The upper map depicts the multiple block regions that compose x and y. The region A and N identify unmatched sequences with high entropy, while H an unmatched sequence with low entropy. Region E and L are a copy of B (high entropy), both with 1% of substitutional mutations. Region J is a copy of C (high entropy) with 1% of substitutional mutations. Region K is a copy of D, both with low entropy. Region I is a copy of F, both with low entropy. Region M is a copy of G, both with high entropy. The sequences have been generated using XS [105] and GOOSE (https://github.com/pratas/goose). For replication use runLocalMethod.sh.
Figure 4
Figure 4
Number of MegaBytes needed for each compression tool to represent a lossless compact form of each dataset. Benchmark for three types of compression is provided: reference-free (C(x)), reference-free conjoint (C(yx)) and relative (C(xy)). The reference-free includes the compression of chromosome sequences corresponding to HS5, PT5, GG5, HS9, PT9, GG9, HS13, PT13, GG13, HS17, PT17, GG17. The reference-free conjoint, the HS5_PT5, HS5_GG5, HS9_PT9, HS9_GG9, HS13_PT13, HS13_GG13, HS17_PT17, HS17_GG17. The relative, the PT5-HS5, GG5-HS5, PT9-HS9, GG9-HS9, PT13-HS13, GG13-HS13, PT17-HS17, GG17-HS17. The prefix initials stand for species (HS→human, PT→chimpanzee, GG→gorilla), the “_” stand for concatenation, and “-” for “relative to”. For replication use scripts runReferenceFreeComparison.sh, runReferenceFreeConjoint.sh and runRelativeCompressorsComparison.sh.
Figure 5
Figure 5
Normalized Relative Compression (Equation (5)) for several substitutional mutations applied to the human mtDNA and gDNA. The “x1” identifies the slope of the mutation rate of 1, while “x2” a 2%. The mutation rate at a given point is identified by multiplying the suffix number by the slope. For replication use runExpectationNRC.sh.
Figure 6
Figure 6
(A) Normalized Compression Distance (NCD at the upper plot, using Equation (3)) and Normalized Relative Compression (NRC at the lower plot, using Equation (5)) of mtDNA, mRNA, and gDNA sequences for several anthropoids in relation to the human genome. The gDNA represents the whole genome, including the unplaced and unlocalized sequences, with exception of the Y chromosome (female species); (B) Evolutionary tree of the gDNA is up to scale, based on the NRC. Letters a, b, c, d, e, and f represent the divergence time between the respective species, while T stands for the actual time. The NRC of the human relatively to the human has been subtracted from each result (≈0.1). All the genomes have been sequenced in T. The bottom right plot represents the Normalized Compression (NC, using Equation (1)) for each species. For replication use the scripts: runNCD.sh, runNRC.sh and runNC.sh.
Figure 7
Figure 7
Time (left), in minutes, and RAM (right), in Gigabytes, needed to compute the NCD and NRC, for the mRNA and the gDNA, in all the measures of Figure 6A. The computation for the mtDNA spent only a few seconds and used less than 0.5 GB of RAM. Given the present orders of magnitude, is asymptotically irrelevant, and, hence, we have excluded from this image. The RAM needed to compute both measures was equivalent for each data type. All the computations were performed in a single core at 2.13 GHz (without parallelization). Unlike the NCD, the NRC can be easily parallelized while maintaining approximately the same RAM using an efficient speed-up.
Figure 8
Figure 8
Patterns of similarity between mtDNA from different anthropoids, estimated with relative compression technology. From the top to the bottom: human-chimpanzee, chimpanzee-gorilla, gorilla-orangutan, orangutan-gibbon, gibbon-baboon, baboon-marmoset. The maps are depicted according to the output of the SMASH-contigs tool. This tool uses a simplified version of the computation of Equation (4). For replication use the script: runRearrange.sh.

References

    1. Kolmogorov A.N. Three approaches to the quantitative definition of information. Probl. Inf. Transm. 1965;1:1–7. doi: 10.1080/00207166808803030. - DOI
    1. Niven R.K. Combinatorial entropies and statistics. Eur. Phys. J. B. 2009;70:49–63. doi: 10.1140/epjb/e2009-00168-5. - DOI
    1. Mantaci S., Restivo A., Rosone G., Sciortino M. A new combinatorial approach to sequence comparison. Theory Comput. Syst. 2008;42:411–429. doi: 10.1007/s00224-007-9078-6. - DOI
    1. Shannon C.E. A mathematical theory of communication. Bell Syst. Tech. J. 1948;27:379–423, 623–656. doi: 10.1002/j.1538-7305.1948.tb01338.x. - DOI
    1. Solomonoff R.J. A formal theory of inductive inference. Part I. Inf. Control. 1964;7:1–22. doi: 10.1016/S0019-9958(64)90223-2. - DOI

LinkOut - more resources