. 2010 Jun 22;107(25):11632-7.
doi: 10.1073/pnas.0914293107. Epub 2010 Jun 7.

Robust control of the seasonal expression of the Arabidopsis FLC gene in a fluctuating environment

Affiliations

Robust control of the seasonal expression of the Arabidopsis FLC gene in a fluctuating environment

Shinichiro Aikawa et al. Proc Natl Acad Sci U S A. .

Abstract

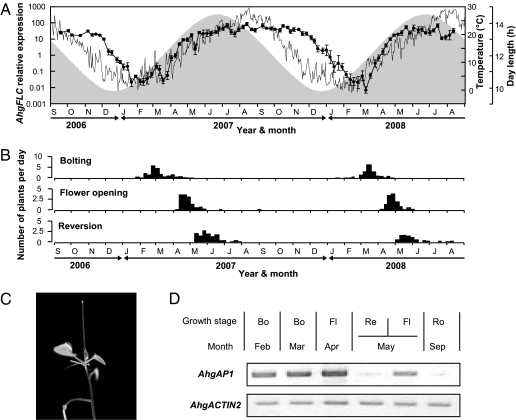
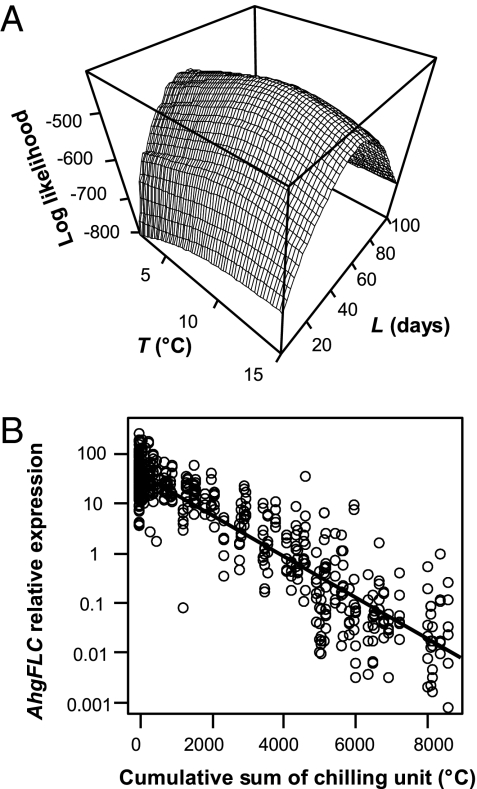
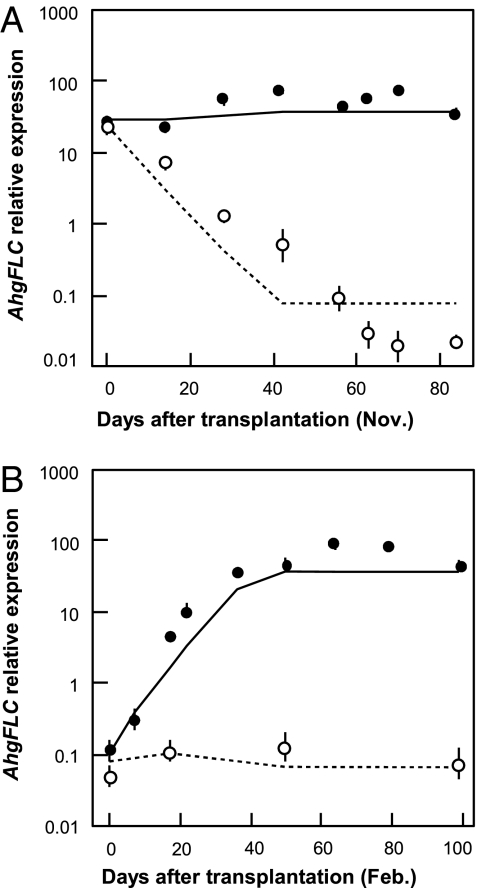
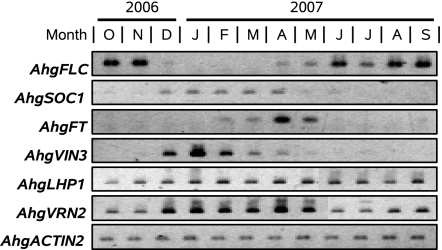
Plants flower in particular seasons even in natural, fluctuating environments. The molecular basis of temperature-dependent flowering-time regulation has been extensively studied, but little is known about how gene expression is controlled in natural environments. Without a memory of past temperatures, it would be difficult for plants to detect seasons in natural, noisy environments because temperature changes occurring within a few weeks are often inconsistent with seasonal trends. Our 2-y census of the expression of a temperature-dependent flowering-time gene, AhgFLC, in a natural population of perennial Arabidopsis halleri revealed that the regulatory system of this flowering-time gene extracts seasonal cues as if it memorizes temperatures over the past 6 wk. Time-series analysis revealed that as much as 83% of the variation in the AhgFLC expression is explained solely by the temperature for the previous 6 wk, but not by the temperatures over shorter or longer periods. The accuracy of our model in predicting the gene expression pattern under contrasting temperature regimes in the transplant experiments indicates that such modeling incorporating the molecular bases of flowering-time regulation will contribute to predicting plant responses to future climate changes.


Conflict of interest statement

The authors declare no conflict of interest.

Figures

Fig. 1.
Fig. 1.
Sequence analysis and transformation experiments of AhgFLC. (A) AhgFLC forms a clade with A. thaliana FLC (FLC) in a neighbor-joining cladogram including FLC homologs of related plants in Brassicaceae. AaFLC, BnFLC, RsFLC, SaFLC, ThFLC, and PEP1 represent Arabidopsis arenosa, Brassica napus, Raphanus sativus, Sinapis alba, Thellungiella halophila, and Arabis alpina homologs of FLC, respectively. The percentage of replicate trees in which the associated taxa clustered together in the bootstrap test (1,000 replicates) are shown above nodes, and branch lengths are proportional to the nucleotide substitution rate. (B) Strong delay in flowering was observed for transgenic plants in which AhgFLC was constitutively expressed in A. thaliana. Phenotypes of 7-wk-old transgenic T1 A. thaliana (Col) expressing FLC and AhgFLC are shown from left to right: 35S::FLCCol, 35S::AhgFLCOMO, 35S::AhgFLCINA, and nontransgenic wild-type plant. AhgFLCOMO and AhgFLCINA were obtained from different individuals of A. halleri. (C) Number of rosette leaves of the transgenic plants and wild type at flowering (mean and SD). The numbers above the bars are the total number of plants tested together with the number of nonflowered plants in parentheses. The number of leaves of nonflowered plants was set as 30 in the mean calculation because all nonflowered plants had more than 30 leaves at the end of the growth experiments. Asterisks indicate significant differences in the number of leaves as compared with that of the wild type (Wilcoxon rank-sum test; *P < 0.05; **P < 0.001).
Fig. 2.
Fig. 2.
Expression of AhgFLC in the natural habitat shows a seasonal pattern that corresponds with plant phenology. (A) Seasonal pattern of the AhgFLC expression in leaves (solid line and circles, mean ± SD, n = 6) measured at ~1-wk intervals for 2 y. The thin line indicates daily mean air temperature, and photoperiods are shown by the shading. (B) Phenology of the study population. The number of plants per day that initiated bolting, flower opening, and inflorescence reversion, respectively, between the two successive censuses are shown. (C) Infloresence reversion, i.e., leaf formation at the reproductive shoot-apical meristem. (D) The expression of AhgAP1 in shoot apical meristems corresponded to plant phenology. The AhgAP1 was expressed throughout the period from bolting to flower opening in the apical meristems [left three lanes; meristem tissues of plants at bolting (Bo) in February and March, and at flowering (Fl) in April]. In May, AhgAP1 RNA was present in the meristems of flower-producing inflorescences but absent in the meristems of reverted inflorescences [fourth and fifth lanes; meristem tissues at inflorescence reversion (Re) and flowering (Fl) in May, respectively]. The expression of AhgAP1 was not detected in the meristem of vegetative rosettes [sixth lane; meristem tissue at the rosette stage (Ro) in September]. AhgACTIN2 was used as a loading control. The GenBank accession number for the AhgAP1 cDNA sequence is AB465587.
Fig. 3.
Fig. 3.
Time-series analyses revealed that seasonal variation in the AhgFLC expression is mostly explained by temperature during the past ~6 wk. (A) 3D surface plot of log likelihood function of T (base temperature) and L (length of period) in the chilling accumulation model. As indicated by the peak of the surface (the maximum likelihood), the level of AhgFLC was best explained by the temperature regime over the past 42 d with a base temperature of 10.5 °C. (B) The relative expression of AhgFLC as a function of the cumulative sum of chilling units with the maximum likelihood estimates (L = 42 d and T = 10.5 °C). The model explained most of the variation of AhgFLC (adjusted R2 = 0.83). Log-transformed variables were used for the relative expression of AhgFLC. The line represents the linear regression, which has an intercept of 1.58 (SE = 2.8 × 10⁻², P < 0.001) and a slope of −4.1 × 10⁻⁴ (SE = 8.0 × 10⁻⁶, P < 0.001).
Fig. 4.
Fig. 4.
Changes in AhgFLC expression in the transplant experiments and the model predictions. Plants with high (A) and low (B) AhgFLC expression were transplanted into the two controlled conditions (20 °C/15 °C and 4 °C/4 °C, day/night temperatures) in November and February, respectively. AhgFLC expressions (mean ± SD, n = 6) are shown by closed and open circles for the 20 °C/15 °C and 4 °C/4 °C conditions, respectively. The predictions based on the chilling accumulation model are shown by solid and dashed lines for 20 °C/15 °C and 4 °C/4 °C, respectively.
Fig. 5.
Fig. 5.
Semiquantitative RT-PCR analyses of seasonal expression patterns of AhgFLC, AhgSOC1, AhgFT, AhgVIN3, AhgLHP1, and AhgVRN2 in leaves. These genes are A. halleri homologs (95% or greater sequence homology) of the corresponding A. thaliana genes, which are involved in the vernalization response. The GenBank accession numbers for the AhgFLC, AhgSOC1, AhgFT, AhgVIN3, AhgLHP1, and AhgVRN2 cDNA sequences are AB465585, AB465588, AB465586, AB465590, AB465589, and AB465591, respectively.

References

    1. Richards CL, et al. Perspective on ecological and evolutionary systems biology. Annu Plant Rev. 2009;35:331–351.
    1. Wilczek AM, et al. Effects of genetic perturbation on seasonal life history plasticity. Science. 2009;323:930–934. - PubMed
    1. Simpson GG, Dean C. Arabidopsis, the Rosetta stone of flowering time? Science. 2002;296:285–289. - PubMed
    1. Yanovsky MJ, Kay SA. Living by the calendar: How plants know when to flower. Nat Rev Mol Cell Biol. 2003;4:265–275. - PubMed
    1. He YH, Amasino RM. Role of chromatin modification in flowering-time control. Trends Plant Sci. 2005;10:30–35. - PubMed

Publication types

LinkOut - more resources