. 2015 Sep 21;212(10):1709-23.
doi: 10.1084/jem.20142284. Epub 2015 Aug 31.

Distinct germinal center selection at local sites shapes memory B cell response to viral escape

Affiliations

Distinct germinal center selection at local sites shapes memory B cell response to viral escape

Yu Adachi et al. J Exp Med. .

Abstract

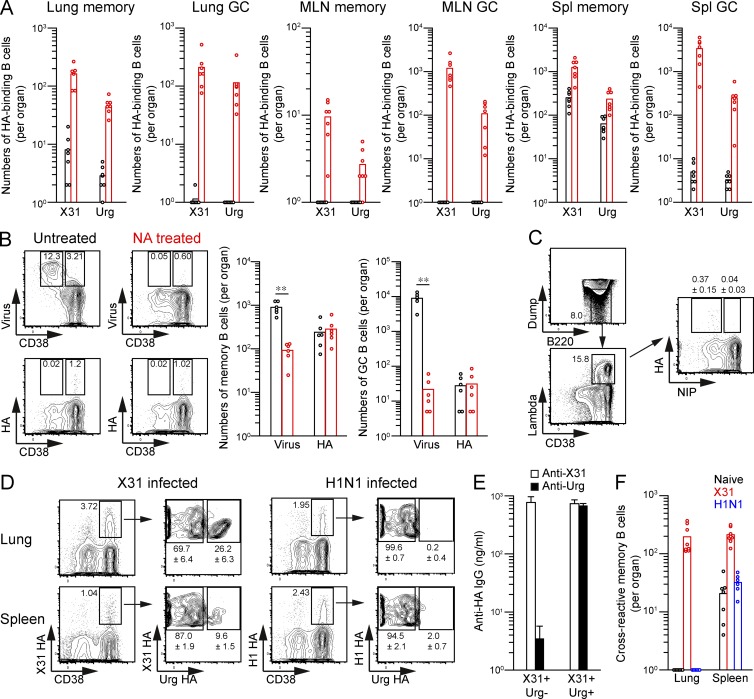
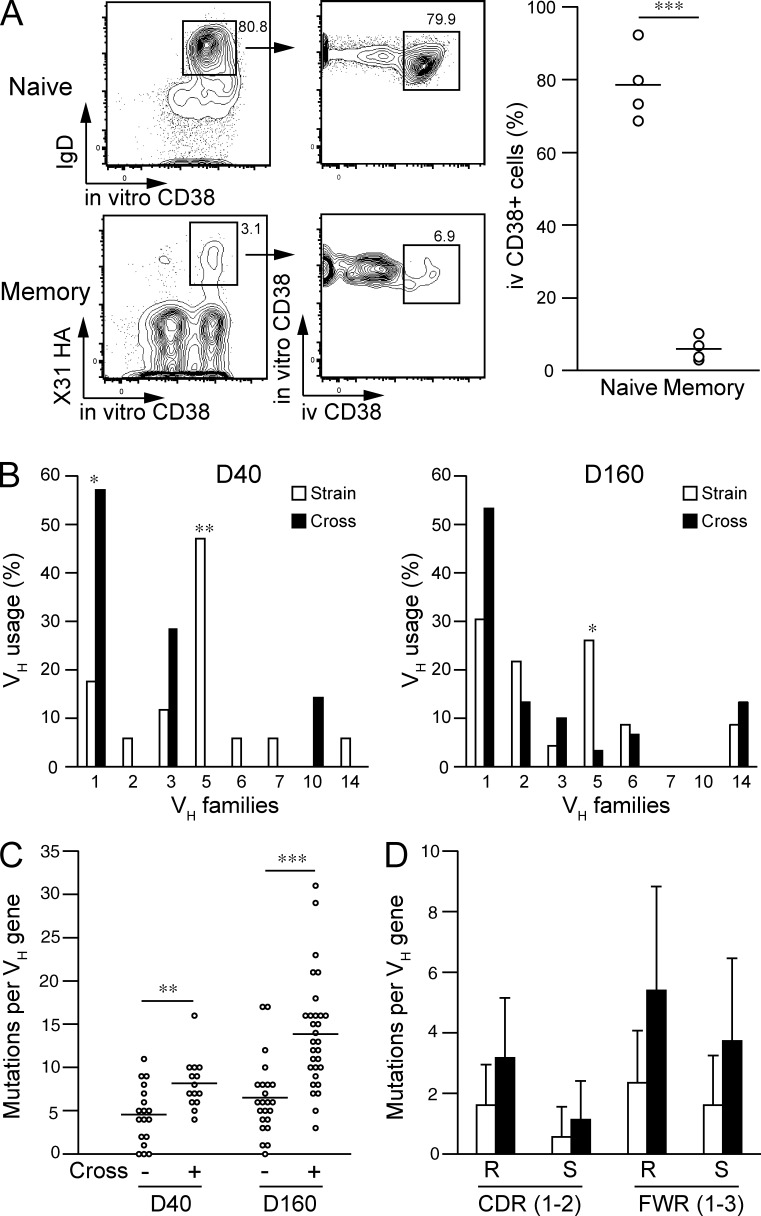
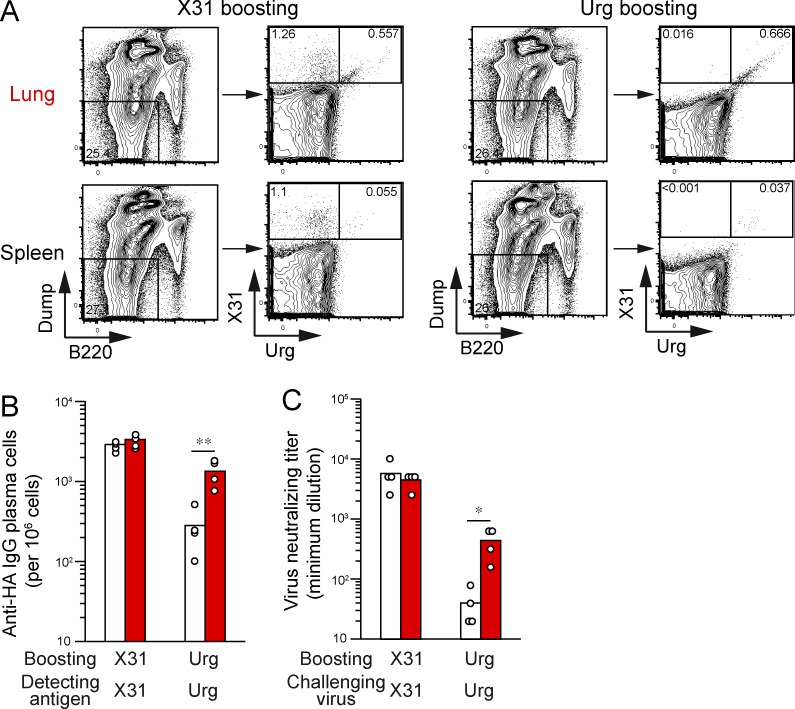
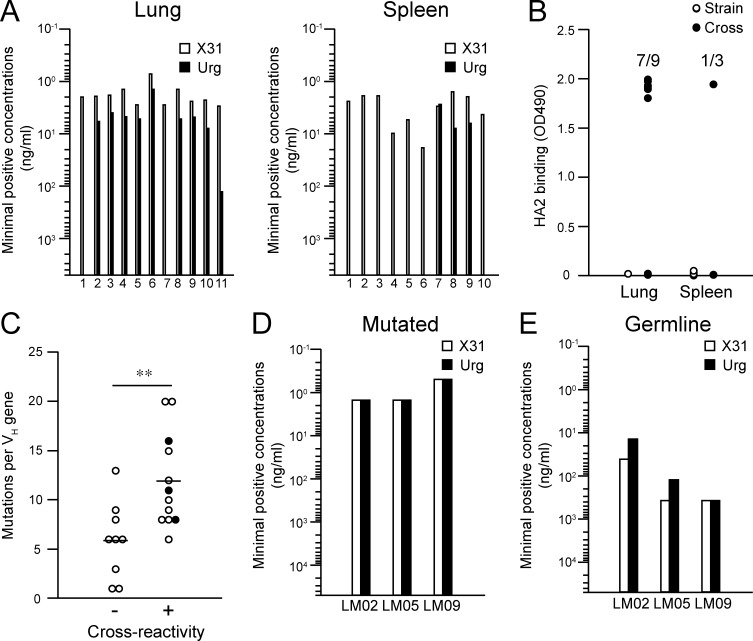
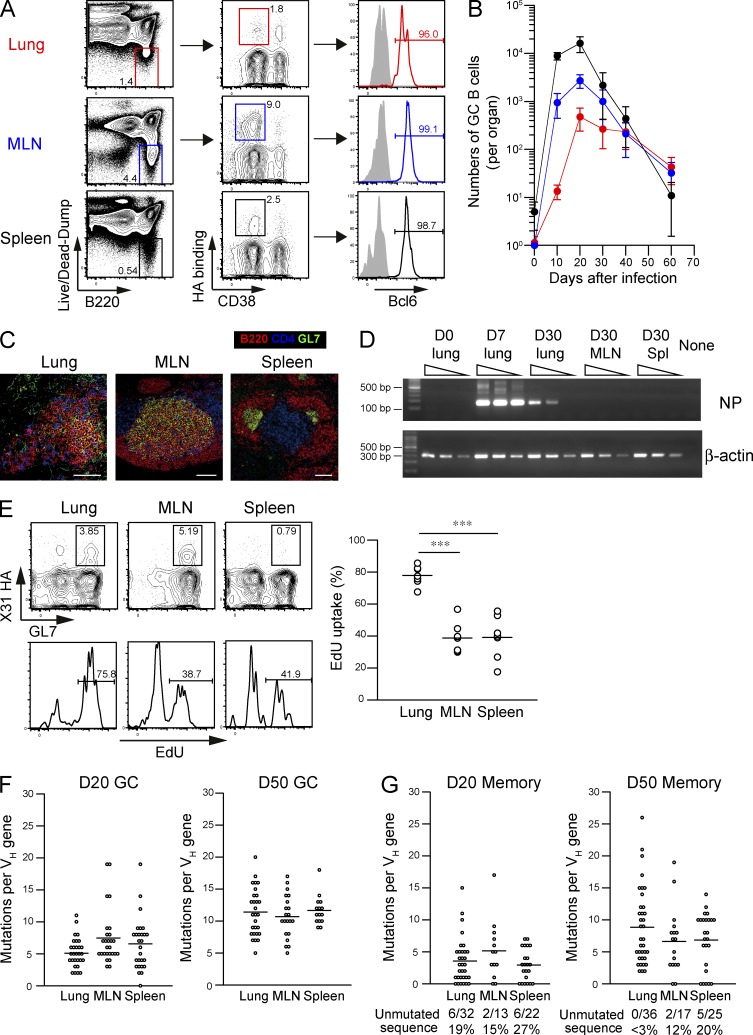
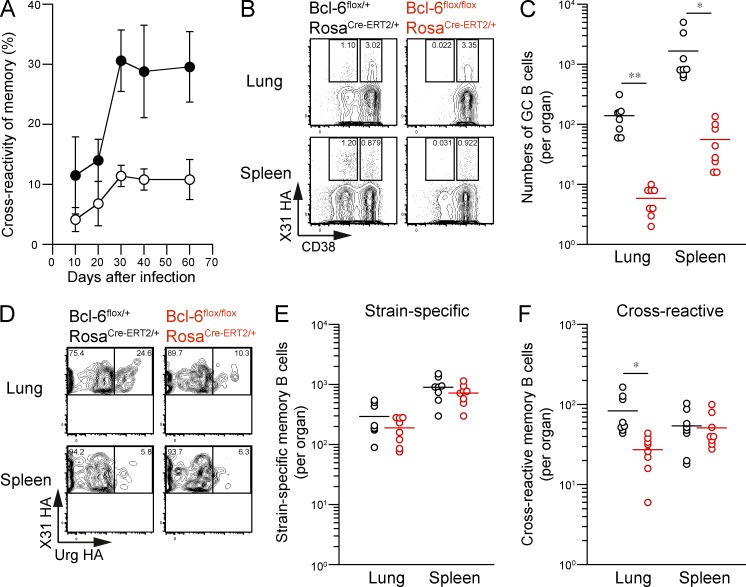
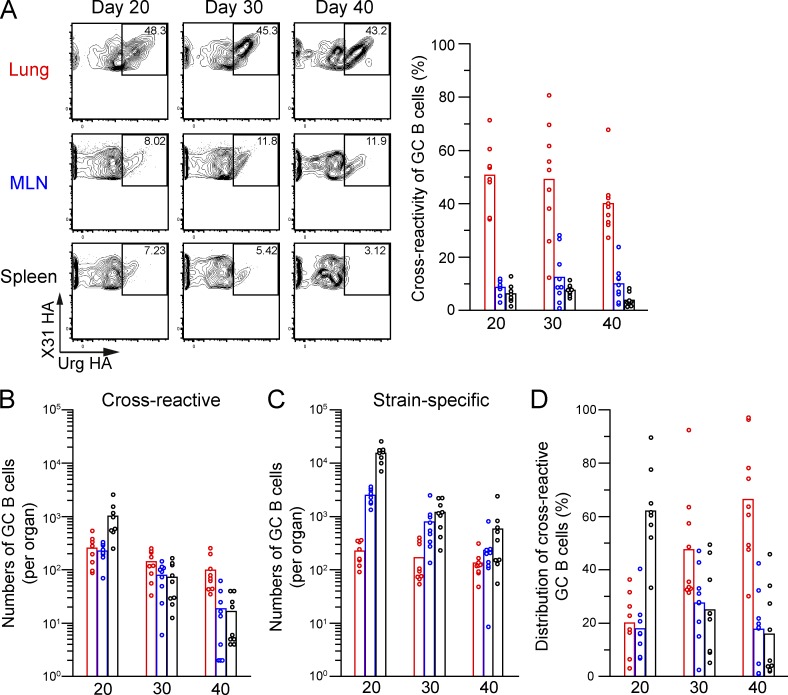
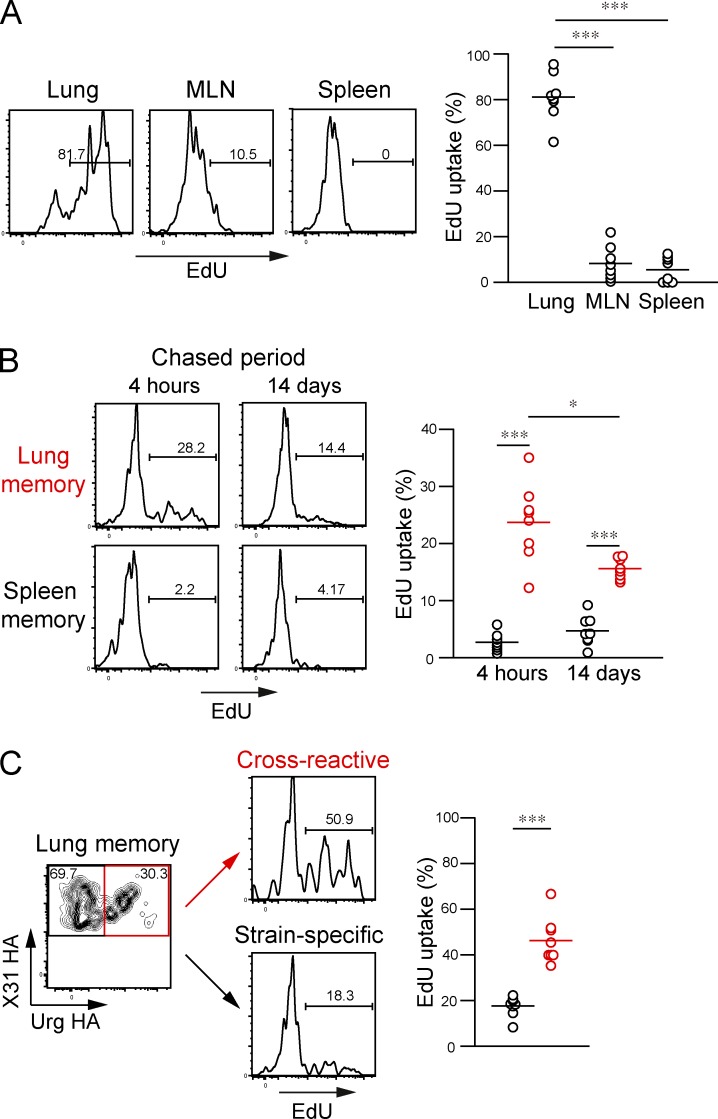
Respiratory influenza virus infection induces cross-reactive memory B cells targeting invariant regions of viral escape mutants. However, cellular events dictating the cross-reactive memory B cell responses remain to be fully defined. Here, we demonstrated that lung-resident memory compartments at the site of infection, rather than those in secondary lymphoid organs, harbor elevated frequencies of cross-reactive B cells that mediate neutralizing antibody responses to viral escape. The elevated cross-reactivity in the lung memory compartments was correlated with high numbers of VH mutations and was dependent on a developmental pathway involving persistent germinal center (GC) responses. The persistent GC responses were focused in the infected lungs in association with prolonged persistence of the viral antigens. Moreover, the persistent lung GCs supported the exaggerated B cell proliferation and clonal selection for cross-reactive repertoires, which served as the predominant sites for the generation of cross-reactive memory progenitors. Thus, we identified the distinct GC selection at local sites as a key cellular event for cross-reactive memory B cell response to viral escape, a finding with important implications for developing broadly protective influenza vaccines.


Figures

Figure 1.
Figure 1.
Simultaneous staining by two HA probes segregates cross-reactive and strain-specific memory B cells. (A) The numbers of X31/Uruguay HA-binding CD38+ (memory) and CD38dull (GC) B cells among the PI-Dump(IgMIgDGr-1CD3CD5CD11bCD11cCD43CD90CD93TER-119F4/80CD117CD138PI)B220+ fraction were counted from naive (black) and X31-infected (red) mice and plotted per organ. (B) Virus- and HA-binding memory phenotype B cells were enumerated in naive spleens with or without neuraminidase (NA) treatment. **, P < 0.01. (C) After gating on the dump(IgDGr-1CD3CD5CD11bCD11cCD43CD90CD93TER-119F4/80CD117CD138PI)B220+CD38+lambda+ fraction, HA-binding cells were compared between NIP-binding and -nonbinding populations in naive spleens from B1-8high mice. Over 20,000,000 events were analyzed from individual spleens, and the cells within enlarged B220 versus dump gate were collected for further analysis. The inset percentages represent the mean ± SD (n = 6). (D) X31 HA-binding lung and splenic memory B cells (PI-DumpCD38+B220+) from X31- and H1N1-infected mice were separated by the cross-reactivity to Uruguay HA at day 40 after infection. The inset percentages represent the mean ± SD (n ≥ 6). (E) X31 HA-binding lung memory B cells with or without cross-reactivity to Uruguay HA were sorted and stimulated with LPS and IL-2/IL-4/IL-5 for 6 d on a layer of 3T3 fibroblasts. Anti-HA IgG Ab levels in culture supernatants from sorted memory B cells were determined by ELISA. The data represent the mean ± SD of three replicates and are representative of three independent experiments. (F) The numbers of cross-reactive memory B cells from naive, X31-, and H1N1-infected mice were plotted per organ. (A, B, and F) Each circle represents the result from an individual mouse. (A–C and F) The data are representative of two independent experiments.
Figure 2.
Figure 2.
Highly mutated, cross-reactive memory B cells accumulate in the lungs. (A) After intravascular injection of CD38 mAbs, lung naive B cells (IgD+CD38+B220+) and HA-binding memory B cells (PI-DumpCD38+B220+) were evaluated for intravascular staining. The flow cytometric gating used for analysis is shown, and the percentages of i.v. CD38+ cells are plotted. Each circle represents the result from an individual mouse. The data are representative of three independent experiments. ***, P < 0.001. (B–D) Cross-reactive and strain-specific memory B cells were sorted at days 40 and 160 after infection and subjected to VH repertoire and mutation analysis. Data are derived from VH sequences (day 40 strain, 18; day 40 cross, 14; day 160 strain, 23; day 160 cross, 30) that were obtained from three independent experiments. (B) VH usage was compared among strain-specific versus cross-reactive memory B cells. *, P < 0.05; **, P < 0.01. (C) Each circle represents the total numbers of VH mutations for an individual cell. **, P < 0.01; ***, P < 0.001. (A and C) Horizontal lines indicate mean. (D) Numbers of replacement and silent mutations in CDR1–2 and FWR1–3 were plotted. The data represent the mean ± SD.
Figure 3.
Figure 3.
Lung memory B cells mediate cross-reactive secondary IgG response. Sorted X31 HA-binding memory B cells (PI-DumpCD38+B220+) from lungs or spleens were transferred into CB17-scid mice (n = 4) with CD4+ T cells from infected mice and splenic B cells from naive mice. (A) At day 6 after boosting with X31 or Uruguay viruses, X31 HA-binding IgMIgDGr-1CD3CD90F4/80PIB220dull cells in splenocytes were gated and the cross-reactivity of restimulated memory B cells estimated. (B) Anti-HA IgG plasma cells in splenocytes were counted by ELISPOT using the same type of HA antigens for boosted virus strains. **, P < 0.01. (C) Serum Abs were recovered from memory cell–reconstituted mice and subjected to a microneutralization assay using MDCK cells after serial dilution (starting at a 1:10 dilution). The boosted virus strains were used for in vitro challenge. Each circle represents the result from an individual mouse. The data are representative of three independent experiments. *, P < 0.05.
Figure 4.
Figure 4.
Cross-reactive mAbs target HA2 stem domain in a mutation-independent manner. HA-binding recombinant mAbs were generated from HA-binding memory B cells (PI-DumpCD38+B220+) in lungs and spleens. (A) The minimal concentrations for binding to X31 and Uruguay716 were determined by ELISA. (B) Binding to HA2 peptide was analyzed by ELISA, and data are representative of three independent experiments. (C) Lung and splenic mAbs were subgrouped by their cross-reactivity to the Uruguay716 virus. The total number of mutations is plotted for each group. Closed symbols show the original clones used for germline reversion. Horizontal lines indicate mean. **, P < 0.01. (D and E) The mutated and germline forms of three mAbs (LM02, LM05, and LM09) were assessed by ELISA to determine the minimal concentrations for binding to X31 and Uruguay716. The detection limit of this assay was set at 50 µg/ml because of background signals from irrelevant germline mAbs. The data are representative of three independent experiments.
Figure 5.
Figure 5.
Infection-induced persistent GCs generate highly mutated B cells. (A) HA-binding GC B cells [Live/Dead-Dump(IgMIgDGr-1CD3CD5CD11bCD11cCD43CD90CD93TER-119F4/80CD117CD138Live/Dead-Aqua)CD38dullB220+] were gated, and the intracellular expression of Bcl-6 protein was evaluated by flow cytometry. The data are representative of three independent experiments. (B) The numbers of HA-binding GC B cells (PI-DumpCD38dullB220+) in each organ are plotted at the indicated time points (mean ± SD; n = 4–9). Over 20,000,000 events were analyzed from individual spleens, and the cells within enlarged B220 versus dump gate were collected for further analysis at days 40 and 60 as shown in Fig. S1. The data are representative of two independent experiments. (C) Frozen sections (8 µm) were prepared from mice (n = 7) at day 30 after infection and stained with B220/CD4/GL7. In total, 569 (lungs), 272 (MLNs), and 1,439 (spleens) GL7+B220+ GC B cell clusters were scanned, and representative images on mean size are presented. Bars, 100 µm. (D) RNAs were extracted from the indicated organs (n = 6), serially diluted at threefold dilution, and subjected to one-step RT-PCR analysis for NP (40 cycles) and β-actin (23 cycles) genes. The data are representative of two independent experiments. (E) After intraperitoneal EdU injection (1 mg) at day 30 after infection, the EdU uptake of HA-binding GL7+ cells among Live/Dead-DumpB220+ gate (as shown in A) in the indicated organs was analyzed 8 h later. Representative flow data for EdU labeling are presented, and the EdU+ ratios of HA-binding GC B cells are plotted. Each circle represents the result from an individual mouse. The data are representative of three independent experiments. ***, P < 0.001. (F and G) HA-binding GC B cells (PI-DumpCD38dullB220+; F) and memory B cells (PI-DumpCD38+B220+; G) were subjected to VH mutation analysis at days 20 and 50 after infection. Each circle represents the result from an individual cell. The combined data from three independent experiments are shown. (E–G) Horizontal lines indicate mean.
Figure 6.
Figure 6.
Cross-reactive memory B cells develop from persistent GCs. (A) The cross-reactivity of splenic (open) and lung (closed) memory B cells (HA-binding PI-DumpCD38+B220+) was assessed at the indicated time points (mean ± SD; n = 4–9). The data are representative of two independent experiments. (B) Mice with the indicated genotypes were orally treated with 2 mg tamoxifen at days 14 and 15 after infection, and lung and spleen cells were recovered at day 28 after infection. HA-binding GC (PI-DumpCD38dullB220+) and memory B cells (PI-DumpCD38+B220+) were gated. (C) The numbers of GC B cells per organ are plotted. *, P < 0.05; **, P < 0.01. (D) The cross-reactivity of memory B cells was compared for each mouse genotype. (E and F) The numbers of strain-specific (E) and cross-reactive (F) memory B cells are plotted. To detect the low frequency of splenic memory B cells, over 20,000,000 events were analyzed from individual spleens, and the cells within enlarged PI-DumpB220+ gate were collected as shown in Fig. S1. *, P < 0.05. (C, E, and F) Each circle represents the result from an individual mouse. The data are representative of three independent experiments. Horizontal lines indicate mean.
Figure 7.
Figure 7.
Site-specific selection of cross-reactive GC B cells. (A) The cross-reactivity of HA-binding GC B cells (PI-DumpCD38dullB220+) was analyzed in the lungs, MLNs, and spleens and plotted at several time points (n = 8–9). To reliably detect the low frequency of cross-reactive GC B cells in spleens, over 20,000,000 events were analyzed from individual spleens, and the cells within the PI-DumpB220+ gate were collected at day 40. (B and C) The numbers of cross-reactive (B) and strain-specific (C) GC B cells in each organ were calculated using the flow cytometric data and the number of cells recovered for the organ. (D) The distribution of cross-reactive GC B cells in each organ was calculated from the cell numbers shown in B and C. (A–D) Each circle represents the result from an individual mouse. The data are representative of two independent experiments.
Figure 8.
Figure 8.
Lung GCs supply cross-reactive memory B cells in the lungs. (A) After intratracheal EdU injection (100 µg in 100 µl PBS) on alternate days from day 18 to 30, the EdU uptake of HA-binding GL7+ cells among the Live/Dead-DumpB220+ gate (as shown in Fig. 5, A and E) in the indicated organs was analyzed at day 30. Representative flow data for EdU staining are presented, and the EdU uptake of GC B cells in the indicated organs is plotted. ***, P < 0.001. (B) EdU uptake of memory B cells (HA-binding GL7 among the Live/Dead-DumpB220+ gate) was analyzed at 4 h and 14 d after the final EdU injection. Representative flow data for EdU staining and EdU uptake of memory B cells are presented. *, P < 0.05; ***, P < 0.001. (C) Lung memory B cells (HA-binding GL7) were divided into cross-reactive and strain-specific populations, and the EdU uptake of each population analyzed. The representative flow data and EdU uptake of each memory B cell population are presented. ***, P < 0.001. (A–C) Each circle represents the result from an individual mouse. The data are representative of two independent experiments. Horizontal lines indicate mean.

Comment in

References

    1. Anderson K.G., Sung H., Skon C.N., Lefrancois L., Deisinger A., Vezys V., and Masopust D.. 2012. Cutting edge: intravascular staining redefines lung CD8 T cell responses. J. Immunol. 189:2702–2706. 10.4049/jimmunol.1201682 - DOI - PMC - PubMed
    1. Bachmann M.F., Odermatt B., Hengartner H., and Zinkernagel R.M.. 1996. Induction of long-lived germinal centers associated with persisting antigen after viral infection. J. Exp. Med. 183:2259–2269. 10.1084/jem.183.5.2259 - DOI - PMC - PubMed
    1. Batten M., Ramamoorthi N., Kljavin N.M., Ma C.S., Cox J.H., Dengler H.S., Danilenko D.M., Caplazi P., Wong M., Fulcher D.A., et al. . 2010. IL-27 supports germinal center function by enhancing IL-21 production and the function of T follicular helper cells. J. Exp. Med. 207:2895–2906. 10.1084/jem.20100064 - DOI - PMC - PubMed
    1. Baumgarth N. 2013. How specific is too specific? B-cell responses to viral infections reveal the importance of breadth over depth. Immunol. Rev. 255:82–94. 10.1111/imr.12094 - DOI - PMC - PubMed
    1. Bauquet A.T., Jin H., Paterson A.M., Mitsdoerffer M., Ho I.C., Sharpe A.H., and Kuchroo V.K.. 2009. The costimulatory molecule ICOS regulates the expression of c-Maf and IL-21 in the development of follicular T helper cells and TH-17 cells. Nat. Immunol. 10:167–175. 10.1038/ni.1690 - DOI - PMC - PubMed

Publication types

Associated data