. 2000 Jul;12(7):1093-101.
doi: 10.1105/tpc.12.7.1093.

Extensive duplication and reshuffling in the Arabidopsis genome

Affiliations

Extensive duplication and reshuffling in the Arabidopsis genome

G Blanc et al. Plant Cell. 2000 Jul.

Abstract

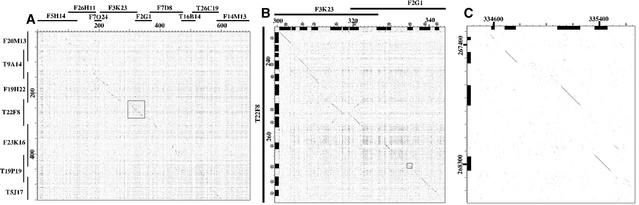
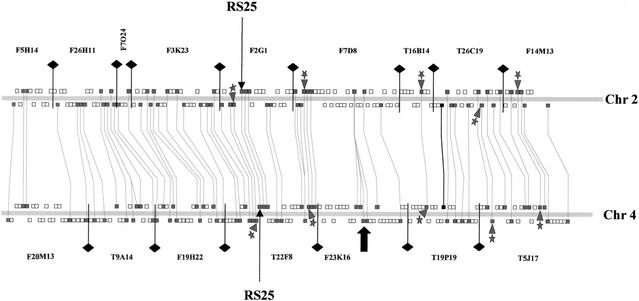
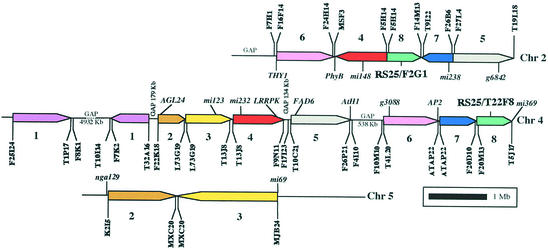
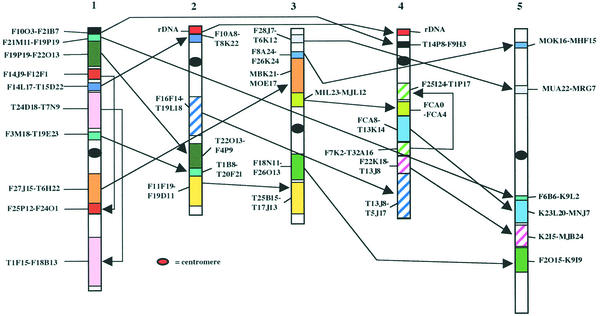
Systematic analysis of the Arabidopsis genome provides a basis for detailed studies of genome structure and evolution. Members of multigene families were mapped, and random sequence alignment was used to identify regions of extended similarity in the Arabidopsis genome. Detailed analysis showed that the number, order, and orientation of genes were conserved over large regions of the genome, revealing extensive duplication covering the majority of the known genomic sequence. Fine mapping analysis showed much rearrangement, resulting in a patchwork of duplicated regions that indicated deletion, insertion, tandem duplication, inversion, and reciprocal translocation. The implications of these observations for evolution of the Arabidopsis genome as well as their usefulness for analysis and annotation of the genomic sequence and in comparative genomics are discussed.


Figures

Figure 1.
Figure 1.
Dot Plot of BAC Contigs Containing RS25 Sequences. BAC contigs were constructed using the Sequencher program and aligned with the Dotter program. (A) Dot plot of full-length contigs representing 657,655 bp on chromosome 2 (horizontal axis) and 550,140 bp on chromosome 4 (vertical axis). The positions of the BACs are indicated on the axes, and numbers show lengths in kilobases. (B) Enlargement of the region highlighted in (A). Numbers show positions on the complete contigs in kilobases. Black blocks on the axes show positions of predicted genes on the BACs. Genes for which sequences are conserved between the two chromosomes are shown by an asterisk. The square shows the region presented in (C). (C) Enlargement of RS25 genes on both chromosomes. Black boxes show locations of exons in the two genes. The coding regions of the RS25 genes cover bases 40,156 to 41,156 on BAC T22F8 and 38,478 to 39,359 on F2G1.
Figure 2.
Figure 2.
Schematic Representation of Regions Duplicated on Chromosomes 2 and 4. BACs are given for each contig, with arrowheads indicating separations between clones. Predicted genes are shown by small blocks (not to scale) either above (forward strand) or below (reverse strand) the chromosome. Highly similar sequences identified by dot plot analysis and confirmed by BLAST alignment (see Methods) are shaded. Lines link the relative positions of these sequences on chromosomes 2 and 4 (Chr2 and Chr4). Genes encoding the RS25 proteins, which were used to detect the duplication, are labeled. Asterisks with arrowheads show the positions of conserved tRNA genes. The boldface line indicates a conserved gene that shows opposite polarity on the two chromosomes, and the large arrow shows the location of an inverted gene duplication.
Figure 3.
Figure 3.
Schematic Representation of Regions Duplicated on Chromosome 4 and Chromosomes 2 and 5. Highly similar sequences were identified by dot plot analysis and confirmed by BLAST alignment, as described in Methods. Colored blocks indicate the position and orientation of regions on the different chromosomes (Chr).The blocks presented here are identified on the chromosomes by diagonal stripes in Figure 4. Blocks are numbered sequentially on chromosome 4 and in duplicated regions to facilitate identification. The positions of the RS25 genes shown in Figure 1 are indicated. The names of BACs (vertical orientation) are given only at the ends of individual regions. Selected genetic marker positions are indicated (horizontal orientation).
Figure 4.
Figure 4.
Schematic Representation of All Identified Duplications throughout the Arabidopsis Genome. Duplicated regions were identified by BLASTN alignment of whole BAC sequences with all Arabidopsis genomic sequences, as described in Methods. Positions of centromeres and rDNA loci are indicated. Colored blocks identify similar regions on different chromosomes or within chromosomes. BAC clones at the ends of duplicated regions are shown. The regions shown on chromosomes 2, 4, and 5 by diagonal striping correspond to those presented in Figure 3.

References

    1. Altschul, S.F., Gish, W., Miller, W., Myers, E.W., and Lipman, D.J. (1990). Basic local alignment search tool. J. Mol. Biol. 215, 403–410. - PubMed
    1. Ansari-Lari, M.A., Oeltjen, J.C., Schwartz, S., Zhang, Z., Muzny, D.M., Lu, J., Gorrell, J.H., Chinault, A.C., Belmont, J.W., Miller, W., and Gibbs, R.A. (1998). Comparative sequence analysis of a gene-rich cluster at human chromosome 12p13 and its syntenic region in mouse chromosome 6. Genome Res. 8, 29–40. - PubMed
    1. Axelos, M., Bardet, C., Liboz, T., Le Van Thai, A., Curie, C., and Lescure, B. (1989). The gene family encoding the Arabidopsis thaliana translation elongation factor EF-1α: Molecular cloning, characterization and expression. Mol. Gen. Genet. 219, 106–112. - PubMed
    1. Bevan, M., et al. (1998). Analysis of 1.9 Mb of contiguous sequence from chromosome 4 of Arabidopsis thaliana. Nature 391, 485–488. - PubMed
    1. Cavell, A.C., Lydiate, D.J., Parkin, I.A., Dean, C., and Trick, M. (1998). Collinearity between a 30-centimorgan segment of Arabidopsis thaliana chromosome 4 and duplicated regions within the Brassica napus genome. Genome 41, 62–69. - PubMed

Publication types

Associated data

LinkOut - more resources