Comparative Study
. 2004 Aug;14(8):1501-15.
doi: 10.1101/gr.2134504.

Genetic divergence of the rhesus macaque major histocompatibility complex

Affiliations
Comparative Study

Genetic divergence of the rhesus macaque major histocompatibility complex

Riza Daza-Vamenta et al. Genome Res. 2004 Aug.

Abstract

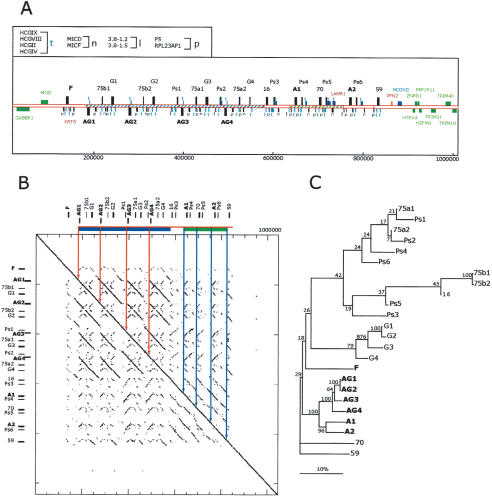
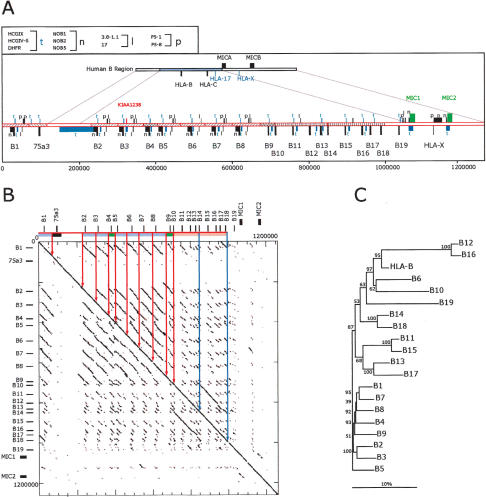
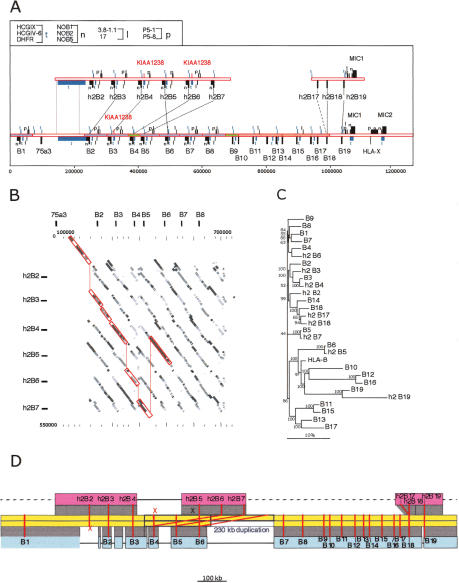
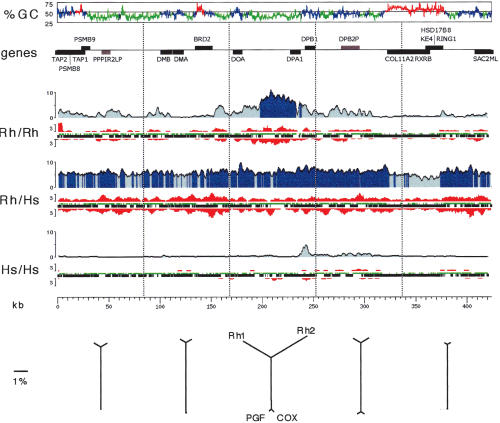
The major histocompatibility complex (MHC) is comprised of the class I, class II, and class III regions, including the MHC class I and class II genes that play a primary role in the immune response and serve as an important model in studies of primate evolution. Although nonhuman primates contribute significantly to comparative human studies, relatively little is known about the genetic diversity and genomics underlying nonhuman primate immunity. To address this issue, we sequenced a complete rhesus macaque MHC spanning over 5.3 Mb, and obtained an additional 2.3 Mb from a second haplotype, including class II and portions of class I and class III. A major expansion of from six class I genes in humans to as many as 22 active MHC class I genes in rhesus and levels of sequence divergence some 10-fold higher than a similar human comparison were found, averaging from 2% to 6% throughout extended portions of class I and class II. These data pose new interpretations of the evolutionary constraints operating between MHC diversity and T-cell selection by contrasting with models predicting an optimal number of antigen presenting genes. For the clinical model, these data and derivative genetic tools can be implemented in ongoing genetic and disease studies that involve the rhesus macaque.


Figures

Figure 2
Figure 2
Description of the expanded, relative to human, mamu-A class I gene region. (A) The 1.1 mb segment extending from GABBR1 to TRIM10 from mamu haplotype 2 is depicted. The positions of class I genes and pseudogenes are indicated by alphanumerical descriptions and bars with direction of transcription indicated by positioning above and below the line according to convention (Table 1 contains a summary description). The positions of homologs to non-class I human genes and pseudogenes are indicated with bars and symbols that are explained in the top, left box. Flanking genes outside of this duplicated area and homologous to those found in the human MHC with conserved structures are indicated by green bars and text. Sequences not present in the corresponding human class I region are indicated by red bars and text. Other non-class I genes are colored in blue. Segments of the sequence with significant similarity indicative of duplication events are indicated with similar hatching bounded by solid lines. The scale below is in base pairs. (B) Dot matrix analysis of the mamu-A region against itself to provide a visualization of the repetitive nature of this segment. The dot plot was generated by a custom python script that divides the query sequence into 100-kb fragments and compares them using cross_match (Ewing and Green 1998; Ewing et al. 1998) against the target sequence. The minmatch score was set at 30 and masklevel was set at 101. All other cross_match parameters were set to default values. The start and end positions for each cross_match hits were plotted using the Biggles python module (biggles.sourceforge.net). Tick marks on the vertical indicate the scale in 200-kb segments and on the horizontal in 50-kb segments. The locations of the class I genes are indicated in relative positions at top and to the left.(C) Phylogenetic analysis of the mamu-A region genes and pseudogenes. Included in this analysis are all mamu class I-like genes contained in this segment (Table 1). Conceptual translations were produced by FASTY (Pearson et al. 1997) comparison of the genomic sequence of each gene or pseudogene with the human HLA-A24 gene (SwissProt 1A24_HUMAN), correcting frameshifts and stop codons of pseudogenes and partial genes. The reconstructed amino acid sequences were aligned using ClustalW with default parameters. Phylogenetic reconstruction was generated using the Neighbor-Joining algorithm (Saitou and Nei 1987), and tested using 1000 rounds of bootstrap analysis. The tree is unrooted. The horizontal bar indicates 10% divergence along each branch.
Figure 3
Figure 3
Analysis of a complete mamu class I B region haplotype. (A) Comparison of human and mamu-B region segments. Top cartoon depicts the homologous human segment extending to scale over the HLA-B and HLA-C region, including the surrounding class I loci as indicated. Immediately beneath is depicted the mamu-B region extending 1.3 Mb and including 19 mamu-B-like genes (see Table 2 for gene summary). Segments of similarity between rhesus and human are bounded by lines connecting the two cartoons. The positions of homologs to human genes and pseudogenes are indicated with bars and symbols that are explained in the top, left box. Orthologous genes with conserved functional structure are indicated by green bars and text. Segments with significant similarity indicative of past duplication events are indicated with similar hatching bounded by solid lines. The placement of bars above or below the line indicates direction of transcription according to convention. The scale below is in base pairs. (B) Dot matrix analysis of the mamu-B region haplotype 2 against itself. The dot plot was generated by a custom python script that divides the query sequence into 100-kb fragments and compares them using cross_match (Ewing and Green 1998; Ewing et al. 1998) against the target sequence. The minmatch score was set at 30 and the masklevel was set at 101. All other cross_match parameters were set to default values. The start and end positions for each cross_match hit were plotted using the Biggles python module. Tick marks indicate the scale in 200-kb segments on the vertical and 50 kb on the horizontal. The locations of the class I genes are indicated in relative positions at top and to the left. Similarity among segments is indicated by similar coloring within the bar on the top and further bounded by vertical lines within the box. (C) Phylogenetic analysis of all mamu-B-like genes in the region based on 5-kb of genomic sequence surrounding each gene. Included in this analysis are all of those genes from haplotype 1 listed in Table 2. A multiple alignment of the repeat-masked genomic sequences was performed using ClustalW with default parameters. Phylogenetic reconstruction was generated using the Neighbor-Joining algorithm (Saitou and Nei 1987) and tested using 1000 rounds of bootstrap analysis. The tree is unrooted. The horizontal bar indicates 10% divergence along each branch.
Figure 4
Figure 4
Comparison of two mamu-B haplotype sequences. (A) Two segments from haplotype 2 spanning 564 and 181 kb from the telomeric and centromeric ends of the region, respectively, are aligned above the corresponding complete haplotype 1 segment. Genes and other sequences are indicated as described in the legend to Figure 3. Lines between the top and bottom mamu-B genes indicate the most closely related sequences between the two haplotypes (alleles). (B) Dot matrix similarity between the segments from haplotype 2 containing h2-B2 though h2-B7 and the B2 though B8 segment from haplotype 1. Shading of dots indicates percent identity in equal integer gradations from 5% gray (90% identity) to black (100% identity). Red lines enclose and connect the matrix at positions that have the highest percent similarity between loci from the respective haplotypes. The comparisons were done using cross_match as described in the legend to Figure 2. Tick marks indicate the scale in 100-kb segments on the vertical and 20 kb on the horizontal. The locations of the class I genes from haplotype 2 are indicated in relative positions at top and to the left. (C) Phylogenetic analysis of all mamu-B-like genes, based on 5 kb of genomic sequence surrounding each gene. Included in this analysis are all B genes listed in Table 2. A multiple alignment of the repeat-masked genomic sequences was performed using ClustalW with default parameters. Phylogenetic reconstruction was generated using the Neighbor-Joining algorithm (Saitou and Nei 1987), and tested using 1000 rounds of bootstrap analysis. The tree is unrooted. The horizontal bar indicates 10% divergence along each branch. (D) Reconstruction of the evolution of haplotype 1 (blue) and haplotype 2 (red) from the ancestral sequence (yellow), by way of a 230-kb duplication (between the blue boxes), followed by deletions on both sides (black horizontal lines). Dashed gray lines indicate yet unavailable sequence. Red lines connect alleles of mamu-B genes; (x) deleted alleles.
Figure 5
Figure 5
Distribution of mutational events over a 470-kb segment of the MHC class II region. Pairwise comparisons of the two rhesus haplotypes, the two human haplotypes, and one haplotype of each species is indicated immediately to the left of each graph. The graphs reflect the analysis of the aligned sequences only, excluding insertions or deletions. (%GC) G+C content graph in 500-bp windows. Green, blue, and red indicate isochore regions of low, medium, and high G+C content, respectively (window size is 30 kb long, cutoffs are 43% and 50% G+C). (Genes) Location, strand, and identity of genes (black) and pseudogenes (gray). (Rh/Rh) Comparison of the two rhesus haplotypes. The percent divergence is shown in blue (averaged over 2.5-kb windows), with dark blue indicating regions over 5% divergence; the number of insertion/deletion events (at least 3 bp long, averaged over 4.5-kb windows) is shown in red, with upward peaks indicating insertions in Rh1 relative to Rh2, and downward peaks indicating insertions in Rh2 relative to Rh1; aligned regions deriving from interspersed repeats or from unique sequences are shown as green or black horizontal bars, respectively. (Rh/Hs) Comparison of Rh1 with the human COX haplotype. (Hs/Hs) Comparison between the two human haplotypes, COX and PGF (http://www.sanger.ac.uk/HGP/Chr6/MHC/). (kb) Kilobase scale. (Bottom) Distance relationships between the four sequences studied. A multiple alignment computed by the MAP program (see Methods) of the two human and the two rhesus haplotypes was split into five regions of equal lengths (approximate boundaries indicated by vertical dotted lines immediately above). Neighbor-joining trees were reconstructed on the basis of the calculated distances, excluding all gaps and correcting for multiple substitutions.

References

    1. Accolla, R.S., Adorini, L., Sartoris, S., Sinigaglia, F., and Guardiola, J. 1995. MHC: Orchestrating the immune response. Immunol. Today 16: 8–11. - PubMed
    1. Adams, E.J. and Parham, P. 2001. Species-specific evolution of MHC class I genes in the higher primates. Immunol. Rev. 183: 41–64. - PubMed
    1. Anzai, T., Shiina, T., Kimura, N., Yanagiya, K., Kohara, S., Shigenari, A., Yamagata, T., Kulski, J.K., Naruse, T.K., Fujimori, Y., et al. 2003. Comparative sequencing of human and chimpanzee MHC class I regions unveils insertions/deletions as the major path to genomic divergence. Proc. Natl. Acad. Sci. 100: 7708–7713. - PMC - PubMed
    1. Austad, S.N. 1997. Small nonhuman primates as potential models of human aging. Ilar J. 38: 142–147. - PubMed
    1. Bontrop, R.E. 2001. Non-human primates: Essential partners in biomedical research. Immunol. Rev. 183: 5–9. - PubMed

WEB SITE REFERENCES

    1. http://www.sanger.ac.uk/HGP/Chr6/MHC/; The Sanger Institute/The MHC haplotype project.
    1. http://deepc2.zool.iastate.edu/aat/map/mapdoc.html; Information resource on the Multiple Sequence Alignment.
    1. www.fhcrc.org/labs/geraghty; Geraghty lab Web data resource.
    1. www.chori.org/bacpac/; BACPAC Resources center homepage.

Publication types

Associated data