. 1997 Aug 11;138(3):643-56.
doi: 10.1083/jcb.138.3.643.

A novel mammalian, mitotic spindle-associated kinase is related to yeast and fly chromosome segregation regulators

Affiliations

A novel mammalian, mitotic spindle-associated kinase is related to yeast and fly chromosome segregation regulators

G Gopalan et al. J Cell Biol. .

Abstract

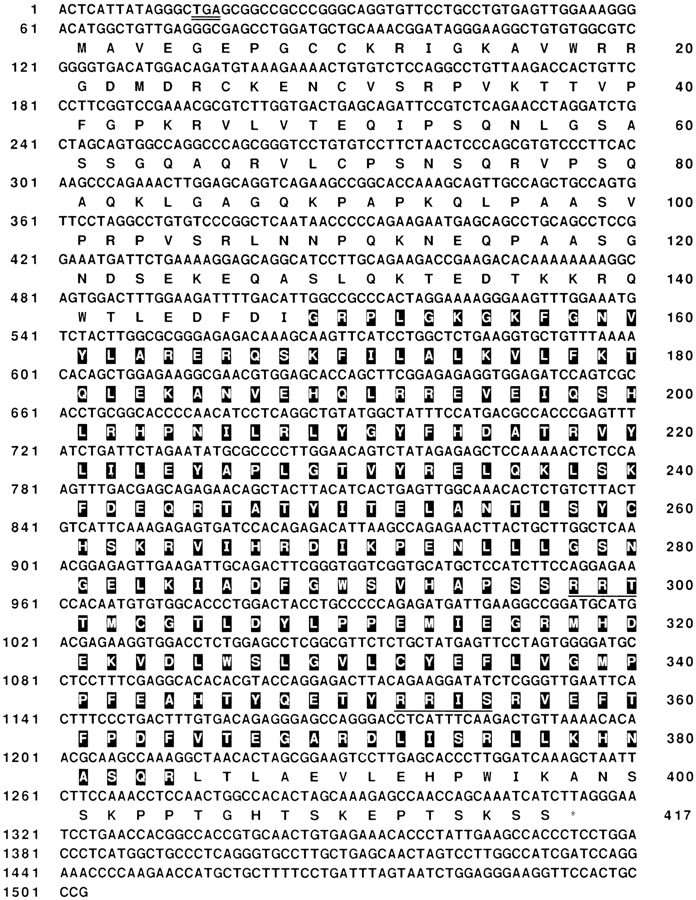
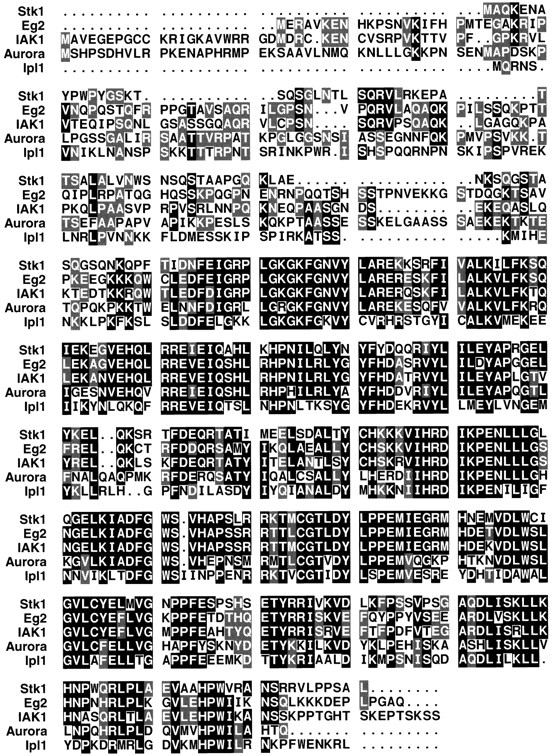
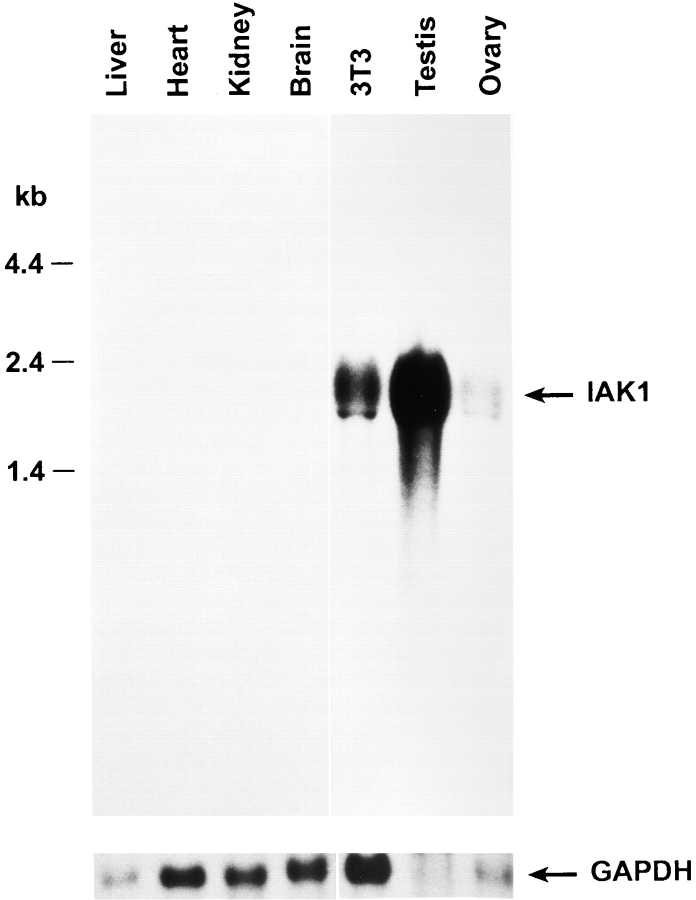
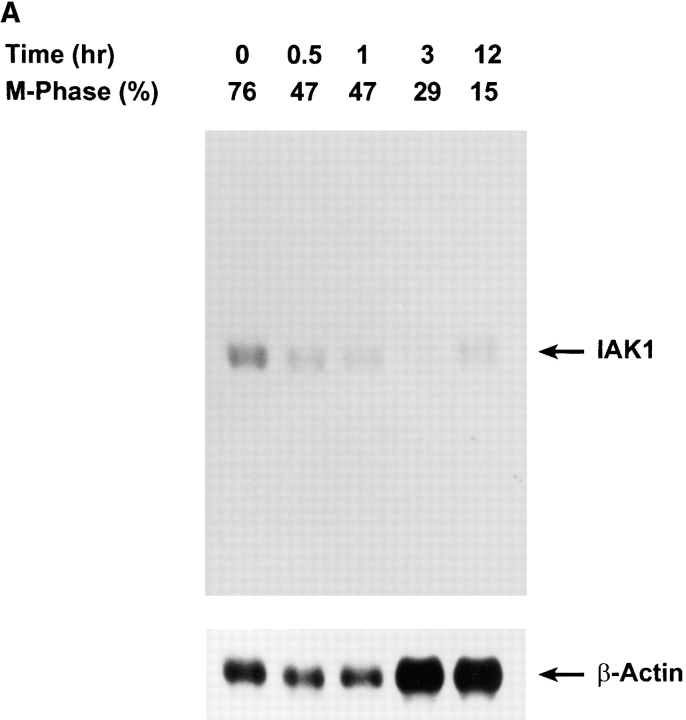
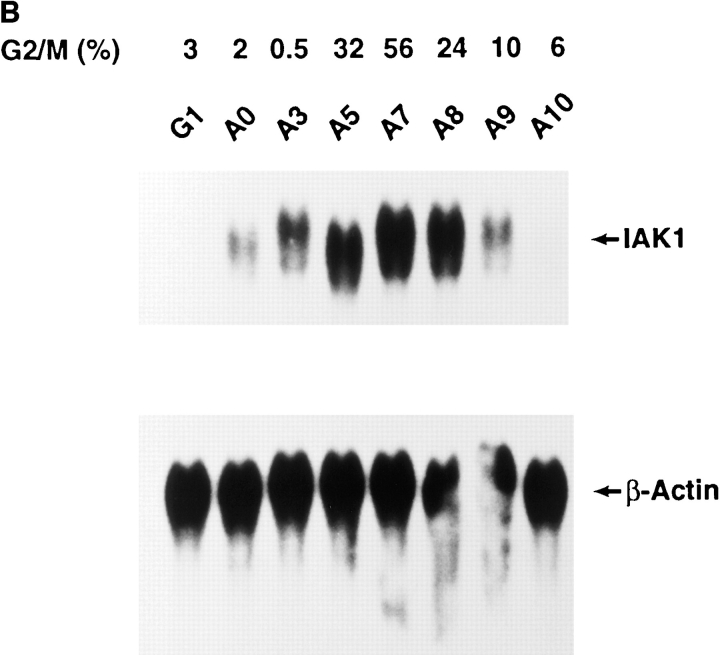
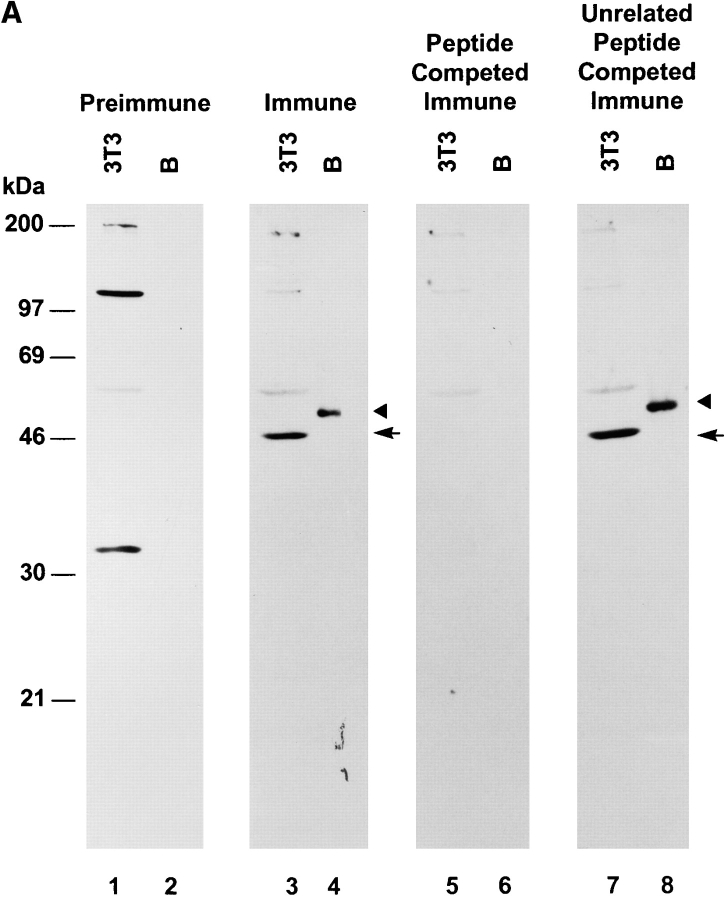
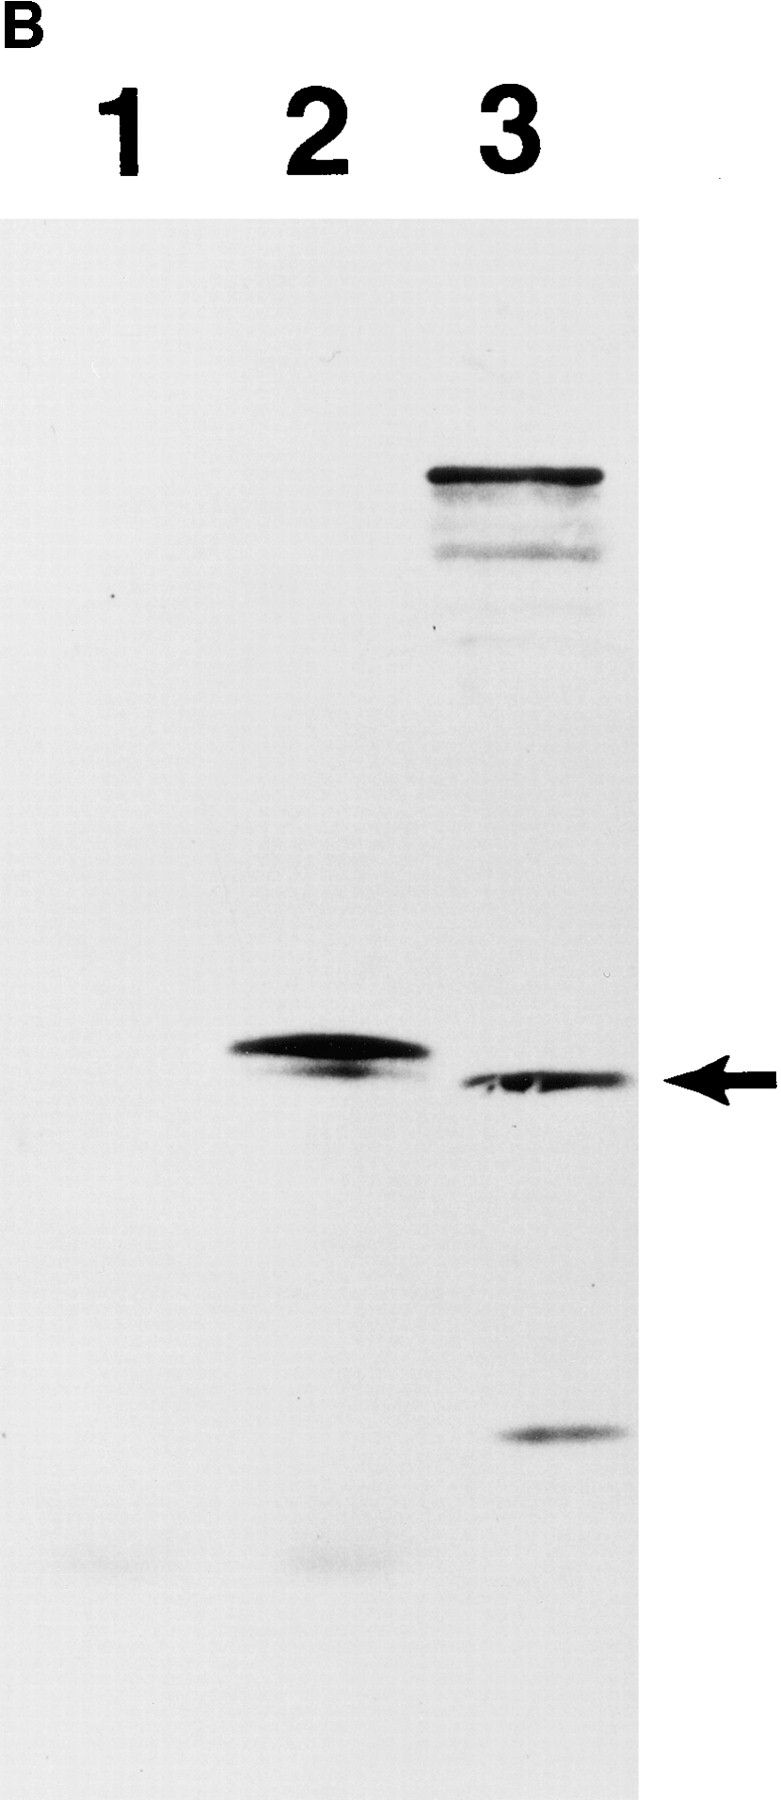
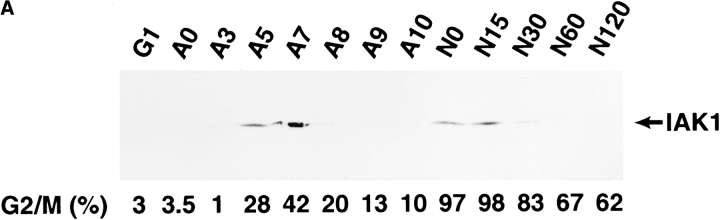
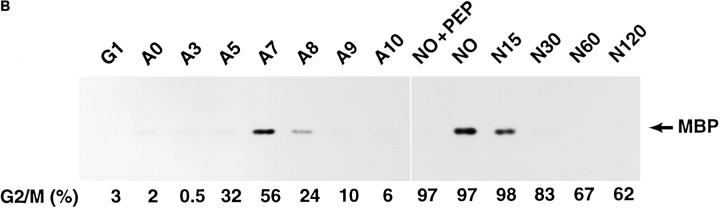
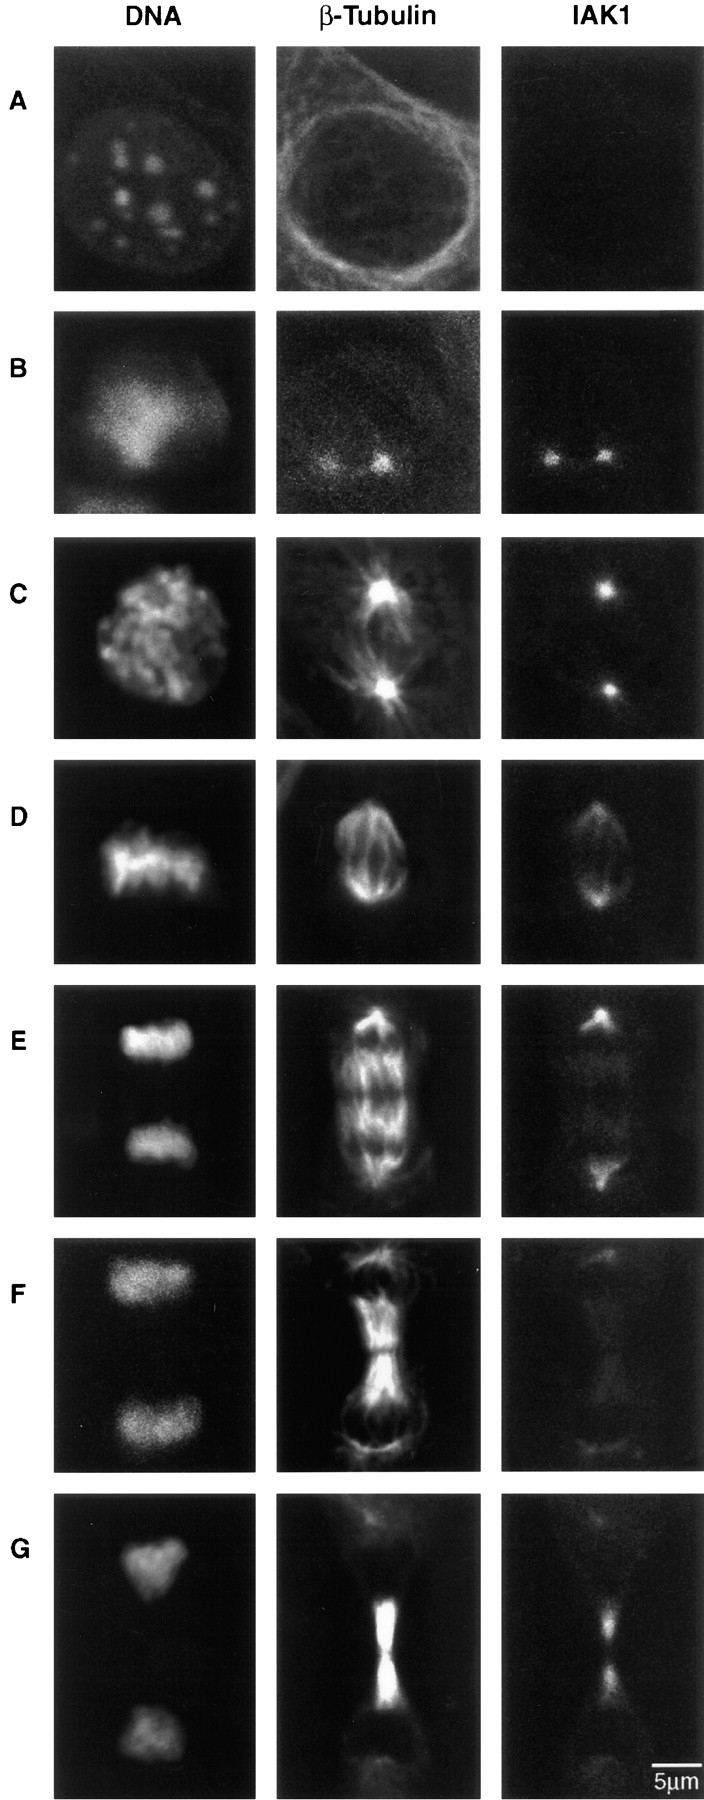
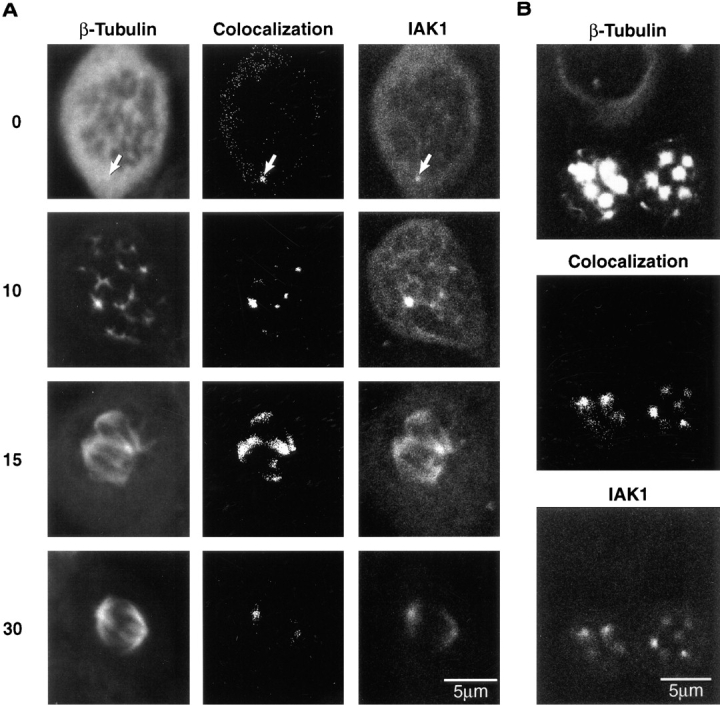
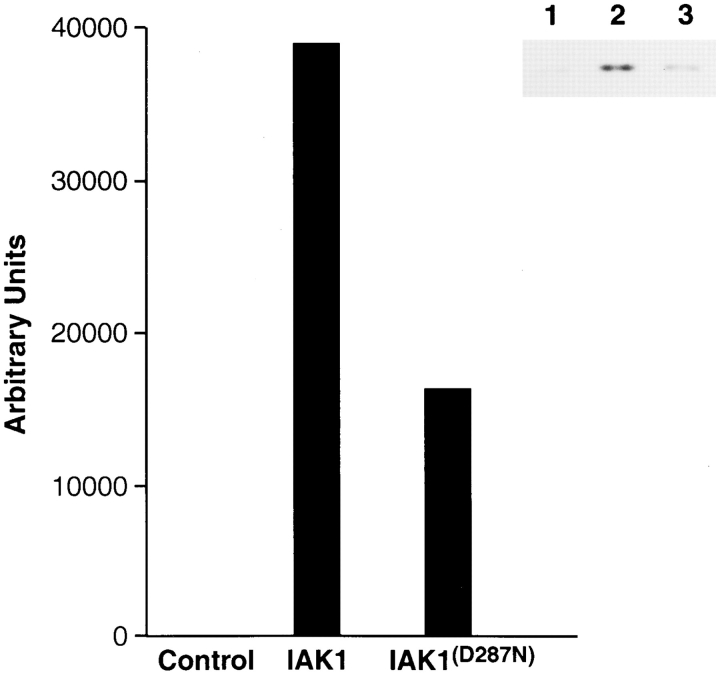
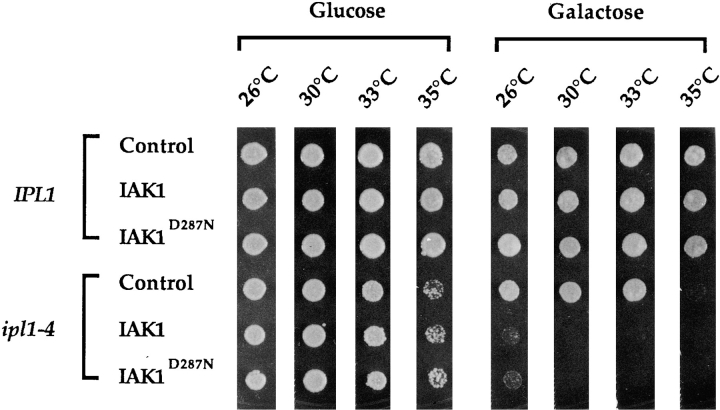
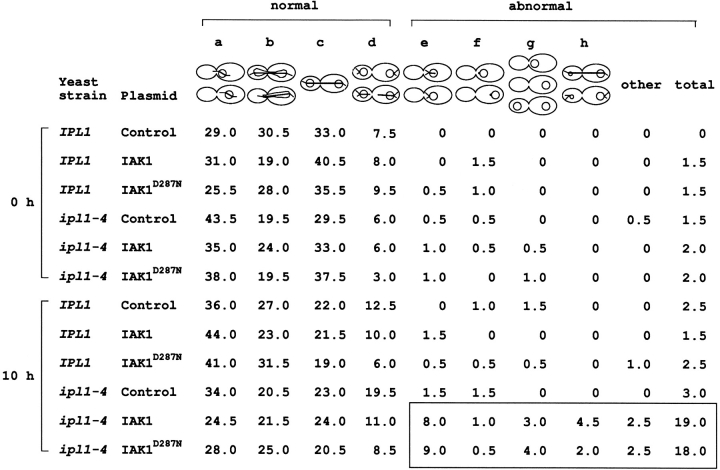
We describe a novel mammalian protein kinase related to two newly identified yeast and fly kinases-Ipl1 and aurora, respectively-mutations in which cause disruption of chromosome segregation. We have designated this kinase as Ipl1- and aurora-related kinase 1 (IAK1). IAK1 expression in mouse fibroblasts is tightly regulated temporally and spatially during the cell cycle. Transcripts first appear at G1/S boundary, are elevated at M-phase, and disappear rapidly after completion of mitosis. The protein levels and kinase activity of IAK1 are also cell cycle regulated with a peak at M-phase. IAK1 protein has a distinct subcellular and temporal pattern of localization. It is first identified on the centrosomes immediately after the duplicated centrosomes have separated. The protein remains on the centrosome and the centrosome-proximal part of the spindle throughout mitosis and is detected weakly on midbody microtubules at telophase and cytokinesis. In cells recovering from nocodazole treatment and in taxol-treated mitotic cells, IAK1 is associated with microtubule organizing centers. A wild-type and a mutant form of IAK1 cause mitotic spindle defects and lethality in ipl1 mutant yeast cells but not in wild-type cells, suggesting that IAK1 interferes with Ipl1p function in yeast. Taken together, these data strongly suggest that IAK1 may have an important role in centrosome and/ or spindle function during chromosome segregation in mammalian cells. We suggest that IAK1 is a new member of an emerging subfamily of the serine/threonine kinase superfamily. The members of this subfamily may be important regulators of chromosome segregation.


Figures

Figure 1
Figure 1
Nucleotide and deduced amino acid sequences of mouse IAK1 cDNA. The composite nucleotide sequence of cDNA clone and the RACE clone is shown. Sequence information is derived from the RACE clone spanning the first 130 bp and the cDNA clone spanning 62–1,503 bp. The in-frame stop codon is doubly underlined. The deduced amino acid sequence of IAK1 kinase is also shown. The putative catalytic domain is displayed in bold face. The PKA consensus phosphorylation sites are underlined.
Figure 2
Figure 2
Amino acid sequence alignment of IAK1 with those of the STK1, Eg2, Ipl1, and aurora kinases. Identical amino acids are shaded. Where amino acids are conserved in three or more of these related kinases, shading is in black. Where amino acids are conserved in only two members, shading is in gray. To maximize alignment, gaps represented by dots were introduced. Amino acid alignments were carried out using the University of Wisconsin Genetics Computer Group Program PILEUP.
Figure 3
Figure 3
Northern blot analysis of IAK1 mRNA expression in adult mouse tissues. Total RNA (30 μg) from adult mouse tissues was separated on a formaldehyde-agarose gel and blotted onto nytran membranes. The blot was hybridized with an 850-bp fragment derived from the PCR clone. The blot was stripped and re-probed with GAPDH to quantitate RNA loading.
Figure 4
Figure 4
Cell cycle analysis of IAK1 expression by Northern blot analysis. (A) Nocodazole block and release: Cells were serum-starved for 48 h in 0.5% β serum–containing medium. After resuming growth in a medium containing 10% serum for 12 h, cells were incubated in a medium containing 0.4 μg/ml of nocodazole for 18 h. Mitotic cells were collected by mechanical shake-off, replated into medium without nocodazole, and allowed to progress though the cell cycle. (B) Aphidicolin block and release: NIH 3T3 cells were serum-starved for 48 h in medium supplemented with 0.5% serum. The starved cells were released into the medium containing 10% serum and 5 μg/ml of aphidicolin for 18 h. After the aphidicolin block, the cells were washed three times in serum-free medium and released into medium containing 10% serum without aphidicolin. Cells were collected at different times after the release, and total RNA was isolated. Northern blot analysis of total RNA isolated from aphidicolin- and nocodazole-blocked and released cells were performed as described above except blots were reprobed with a β-actin probe to quantitate loading. The degree of synchrony of NIH 3T3 cells was determined by propidium iodide staining and flow cytometry and is shown as the percentage of cells of G2/M phase.
Figure 4
Figure 4
Cell cycle analysis of IAK1 expression by Northern blot analysis. (A) Nocodazole block and release: Cells were serum-starved for 48 h in 0.5% β serum–containing medium. After resuming growth in a medium containing 10% serum for 12 h, cells were incubated in a medium containing 0.4 μg/ml of nocodazole for 18 h. Mitotic cells were collected by mechanical shake-off, replated into medium without nocodazole, and allowed to progress though the cell cycle. (B) Aphidicolin block and release: NIH 3T3 cells were serum-starved for 48 h in medium supplemented with 0.5% serum. The starved cells were released into the medium containing 10% serum and 5 μg/ml of aphidicolin for 18 h. After the aphidicolin block, the cells were washed three times in serum-free medium and released into medium containing 10% serum without aphidicolin. Cells were collected at different times after the release, and total RNA was isolated. Northern blot analysis of total RNA isolated from aphidicolin- and nocodazole-blocked and released cells were performed as described above except blots were reprobed with a β-actin probe to quantitate loading. The degree of synchrony of NIH 3T3 cells was determined by propidium iodide staining and flow cytometry and is shown as the percentage of cells of G2/M phase.
Figure 5
Figure 5
(A) Characterization of an IAK1-specific COOH-terminal peptide antiserum. A COOH-terminal peptide antiserum was characterized by Western blot analysis against a bacterially produced recombinant IAK1 protein (lanes B) and extracts of mitotic NIH 3T3 cells (lanes 3T3). For peptide competition, the antiserum was preincubated with 5 μl of a 1 mg/ml solution of the peptide immunogen or an unrelated peptide for 1 h at room temperature before incubation with the blot. The arrowhead indicates bacterially expressed recombinant IAK1, and the arrow indicates the endogenous IAK1 in NIH 3T3 cells. (B) In vitro translation of IAK1. Full-length IAK1 cDNA cloned in pcDNA3 was used for in vitro translation using the TNT T7 Quick Coupled Transcription/Translation system. An aliquot of the translated products was analyzed along with cell extract from nocodazole-blocked cells on 10% polyacrylamide gel. A similar plasmid containing luciferase gene in the place of IAK1 cDNA was used for the control. The gel was blotted and probed with IAK1-specific peptide antiserum as described in the Materials and Methods section. Lane 1, Control luciferase cDNA translated in vitro; lane 2, IAK1 cDNA translated in vitro; lane 3, nocodazole-treated NIH 3T3 cell lysate.
Figure 5
Figure 5
(A) Characterization of an IAK1-specific COOH-terminal peptide antiserum. A COOH-terminal peptide antiserum was characterized by Western blot analysis against a bacterially produced recombinant IAK1 protein (lanes B) and extracts of mitotic NIH 3T3 cells (lanes 3T3). For peptide competition, the antiserum was preincubated with 5 μl of a 1 mg/ml solution of the peptide immunogen or an unrelated peptide for 1 h at room temperature before incubation with the blot. The arrowhead indicates bacterially expressed recombinant IAK1, and the arrow indicates the endogenous IAK1 in NIH 3T3 cells. (B) In vitro translation of IAK1. Full-length IAK1 cDNA cloned in pcDNA3 was used for in vitro translation using the TNT T7 Quick Coupled Transcription/Translation system. An aliquot of the translated products was analyzed along with cell extract from nocodazole-blocked cells on 10% polyacrylamide gel. A similar plasmid containing luciferase gene in the place of IAK1 cDNA was used for the control. The gel was blotted and probed with IAK1-specific peptide antiserum as described in the Materials and Methods section. Lane 1, Control luciferase cDNA translated in vitro; lane 2, IAK1 cDNA translated in vitro; lane 3, nocodazole-treated NIH 3T3 cell lysate.
Figure 6
Figure 6
(A) Western blot analysis of IAK1 levels during the cell cycle. NIH 3T3 cells were blocked at various stages of the cell cycle by serum starvation or treatment with aphidicolin or nocodazole. After release from block, cells were harvested at intervals to collect cells at different stages of the cell cycle. Cell lysates prepared from 400,000 cells were then separated by SDS-PAGE and analyzed by Western blot analysis with the IAK1 antiserum. Cells were harvested 7 h after release from serum starvation (G1), 0, 3, 5, 7, 8, 9, and 10 h after release from aphidicolin block (A0–A10), and 0, 15, 30, 60, and 120 min after release from nocodazole block (N0–N120). The percentage of cells at G2/M phase of the cell cycle, as judged by propidium iodide staining and FACS® analysis, is shown below each lane. (B) Activity profile of IAK1 kinase through cell cycle. NIH 3T3 cells at different stages of the cell cycle were collected as described in Fig. 5 C. Cells were lysed, and in vitro kinase activity of IAK1 was determined in cell lysates using myelin basic protein as the exogenous substrate as detailed in Materials and Methods. The percentage of cells in G2/M phase was determined for each sample by flow cytometry and presented for comparison.
Figure 6
Figure 6
(A) Western blot analysis of IAK1 levels during the cell cycle. NIH 3T3 cells were blocked at various stages of the cell cycle by serum starvation or treatment with aphidicolin or nocodazole. After release from block, cells were harvested at intervals to collect cells at different stages of the cell cycle. Cell lysates prepared from 400,000 cells were then separated by SDS-PAGE and analyzed by Western blot analysis with the IAK1 antiserum. Cells were harvested 7 h after release from serum starvation (G1), 0, 3, 5, 7, 8, 9, and 10 h after release from aphidicolin block (A0–A10), and 0, 15, 30, 60, and 120 min after release from nocodazole block (N0–N120). The percentage of cells at G2/M phase of the cell cycle, as judged by propidium iodide staining and FACS® analysis, is shown below each lane. (B) Activity profile of IAK1 kinase through cell cycle. NIH 3T3 cells at different stages of the cell cycle were collected as described in Fig. 5 C. Cells were lysed, and in vitro kinase activity of IAK1 was determined in cell lysates using myelin basic protein as the exogenous substrate as detailed in Materials and Methods. The percentage of cells in G2/M phase was determined for each sample by flow cytometry and presented for comparison.
Figure 7
Figure 7
Immunocytochemical localization of IAK1 during the cell cycle. Dividing cultures of NIH 3T3 cells were fixed in ice-cold methanol and then triple-stained with DAPI for DNA, with an anti–β-tubulin monoclonal antibody for microtubules and with an anti-IAK1 antiserum. The cells were visualized with a laser scanning confocal microscope as described in Materials and Methods. Cells are at the following stages of the cell cycle: interphase (A), prophase (B), prometaphase (C), metaphase (D), late anaphase (E), telophase (F), and cytokinesis (G). Bar, 5 μm.
Figure 8
Figure 8
(A) Localization of IAK1 in nocodazole-treated cells. NIH 3T3 cells were treated with nocodazole (5 μg/ml) for 4 h, washed in fresh medium, and then fixed in ice-cold methanol at various times after release from nocodazole block. Cells were stained with a monoclonal anti–β-tubulin antibody or an anti-IAK1 antiserum followed by the appropriate secondary antibodies and visualized by laser scanning confocal microscopy as described in Materials and Methods. Shown are cells at time zero (0), 10 min after release from nocodazole (10), 15 min after release (15), and 30 min after release (30). Bar, 5 μm. (B) Localization of IAK1 in taxol-treated cells. NIH 3T3 cells were treated with taxol (10 μM) for 5 h and then fixed in ice-cold methanol. Cells were stained with antibodies as above for β-tubulin and IAK1. The two lower cells represent M-phase cells, while the upper cell is in interphase. Bar, 5 μm.
Figure 9
Figure 9
The mutant IAK1D287N shows reduced kinase activity. Cell extracts from NIH 3T3 cells transiently expressing the flag-tagged IAK1 and IAK1D287N constructs were prepared, and the wild-type and the mutant form of the kinase was selectively isolated using the anti–flag M2 affinity gel as described in the Materials and Methods section. Mock-transfected cells were used as the control. The affinity-purified wild-type and mutant form of the IAK1 kinase was used for the in vitro kinase activity using myelin basic protein as the substrate. The experiment was repeated three times, and the typical result from a single experiment is presented here. The incorporation of [γ-32P]ATP into myelin basic protein was measured using a Molecular Dynamics phosphoimager, and the result is presented in the form of a bar diagram after background correction. The inset shows the autoradiographic representation of the same result. Lane 1, control mock-transfected cells; lane 2, IAK1; lane 3, IAK1D287N.
Figure 10
Figure 10
Expression of mouse IAK1 causes growth inhibition of ipl1 mutant yeast cells. Suspension of yeast carrying high copy number URA3-plasmid pAJ47 (control), IAKWT (containing wild-type IAK1 cDNA under control of the GAL10 promoter), or IAKD287N (containing mutant IAK1D287N cDNA under control of the GAL10 promoter) were spotted on supplemented minimal SD solid medium (lacking uracil) that contained either glucose or galactose as the sole carbon source. These cells were allowed to grow at the indicated temperatures for 3 d, except that cells spotted on galactose medium were allowed to grow at 26°C for 5 d. The isogenic yeast strains used were CCY98-3D-1 (wild-type IPL1) and CCY98-3D-1-1 (mutant ipl1-4).
Figure 11
Figure 11
Expression of IAK1 causes microtubule defects in ipl1 mutant yeast cells. Isogenic wild-type IPL1 (CCY98-3D-1) and mutant ipl1-4 (CCY98-3D-1-1) cells carrying the indicated plasmids (see Fig. 10 for description) were grown to early log phase at 30°C in supplemented minimal SD liquid medium (lacking uracil) that contained 2% raffinose as the sole carbon source (noninducing). At 0 h, galactose was added to give a final concentration of 4% (inducing), and the cultures were incubated at 30°C for another 10 h. At the time indicated, cells were fixed with formaldehyde, and the distribution of chromosomal DNA and microtubules in these cells were examined by indirect immunofluorescence microscopy. For each sample, 200 large-budded cells were scored, and the percentage of cells belonging to each cytological class is shown here. The classes represent: (a) cells with unseparated chromatin mass and a short to medium bipolar mitotic spindle; (b) cells with chromatin mass that is not fully separated and with an elongated, bipolar mitotic spindle; (c) cells with evenly separated chromatin masses and an elongated, bipolar mitotic spindle; (d) cells with evenly separated chromatin masses and a partially disassembled mitotic spindle or no mitotic spindle; (e) cells with unseparated chromatin mass, a single unduplicated or unseparated MTOC (spindle pole body), and an apparently monopolar spindle or no mitotic spindle; (f) cells with unseparated chromatin mass, a single unduplicated or unseparated MTOC, and no other microtubule structure; (g) cells with no MTOC or microtubule structure; and (h) cells clearly with unevenly separated chromatin masses. The boxed region highlights the abnormal phenotypes in ipl-4 yeast expressing the wild-type and IAK1D287N mammalian proteins.

References

    1. Altschul, S.F., W. Gish, W. Miller, E.W. Myers, and D.J. Lipman. 1990. Basic local alignment search tool. J. Mol. Biol., 215:403–410. - PubMed
    1. Bailly E, Doree M, Nurse P, Bornens M. p34cdc2is located in both nucleus and cytoplasm: part is centrosomally associated at G2/M and enters vesicles at anaphase. EMBO (Eur Mol Biol Organ) J. 1989;8:3985–3995. - PMC - PubMed
    1. Blangy A, Lane HA, d'Herin P, Harper M, Kress M, Nigg EA. Phosphorylation by p34cdc2regulates spindle association of human Eg5, a kinesin-related motor essential for bipolar spindle formation in vivo. Cell. 1995;83:1159–1169. - PubMed
    1. Brockman J, Gross SD, Sussman MR, Anderson RE. Cell cycle dependent localization of casein kinase I to mitotic spindles. Proc Natl Acad Sci USA. 1992;89:9454–9458. - PMC - PubMed
    1. Browne CL, Lockwood AH, Su JL, Steiner AL. Immunofluorescent localization of cyclic nucleotide-dependent protein kinases on the mitotic apparatus of cultured cells. J Cell Biol. 1980;87:336–345. - PMC - PubMed

Publication types

MeSH terms

Associated data