

Investigation of the bottleneck leading to the domestication of maize
- PMID: 9539756
- PMCID: PMC22508
- DOI: 10.1073/pnas.95.8.4441
Investigation of the bottleneck leading to the domestication of maize
Abstract
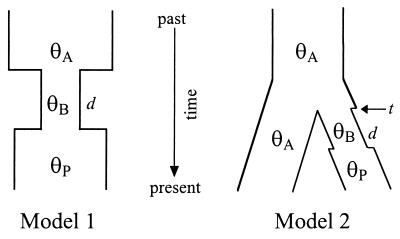
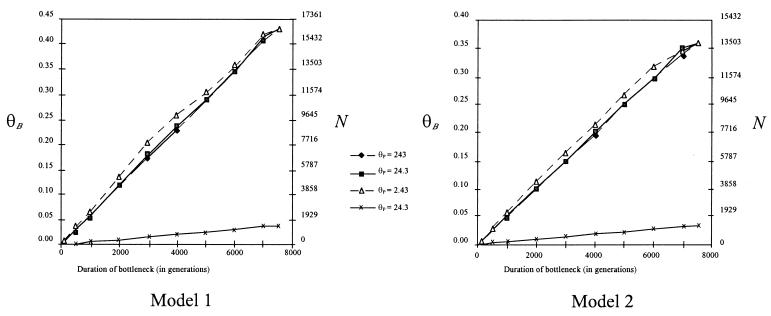
Maize (Zea mays ssp. mays) is genetically diverse, yet it is also morphologically distinct from its wild relatives. These two observations are somewhat contradictory: the first observation is consistent with a large historical population size for maize, but the latter observation is consistent with strong, diversity-limiting selection during maize domestication. In this study, we sampled sequence diversity, coupled with simulations of the coalescent process, to study the dynamics of a population bottleneck during the domestication of maize. To do this, we determined the DNA sequence of a 1,400-bp region of the Adh1 locus from 19 individuals representing maize, its presumed progenitor (Z. mays ssp. parviglumis), and a more distant relative (Zea luxurians). The sequence data were used to guide coalescent simulations of population bottlenecks associated with domestication. Our study confirms high genetic diversity in maize-maize contains 75% of the variation found in its progenitor and is more diverse than its wild relative, Z. luxurians-but it also suggests that sequence diversity in maize can be explained by a bottleneck of short duration and very small size. For example, the breadth of genetic diversity in maize is consistent with a founding population of only 20 individuals when the domestication event is 10 generations in length.
Figures

References
Publication types
MeSH terms
Substances
Associated data
- Actions
- Actions
- Actions
- Actions
- Actions
- Actions
- Actions
- Actions
- Actions
- Actions
- Actions
- Actions
- Actions
- Actions
- Actions
- Actions
- Actions
- Actions
- Actions
- Actions
LinkOut - more resources
Full Text Sources
Other Literature Sources
