. 1998 Oct;118(2):637-50.
doi: 10.1104/pp.118.2.637.

Superoxide dismutase in Arabidopsis: an eclectic enzyme family with disparate regulation and protein localization

Affiliations

Superoxide dismutase in Arabidopsis: an eclectic enzyme family with disparate regulation and protein localization

D J Kliebenstein et al. Plant Physiol. 1998 Oct.

Abstract

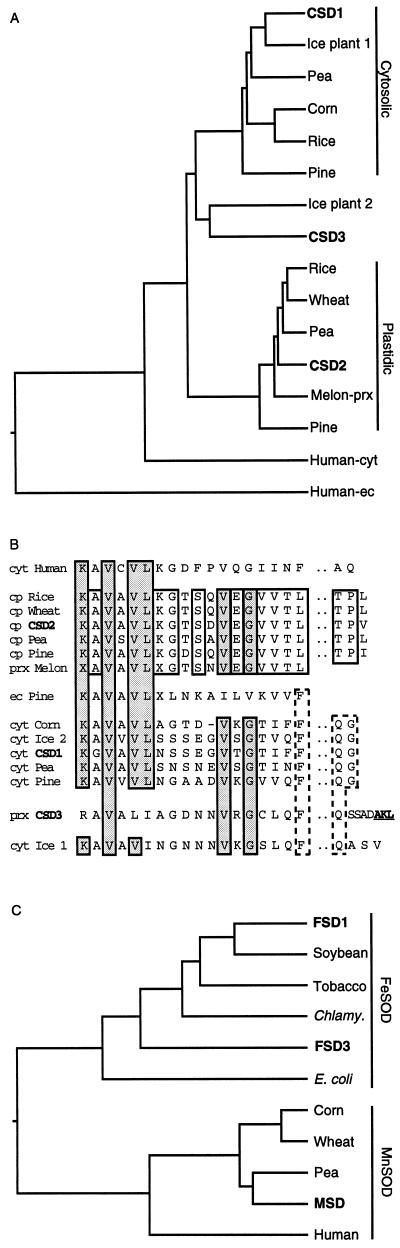
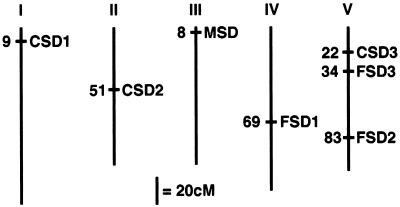
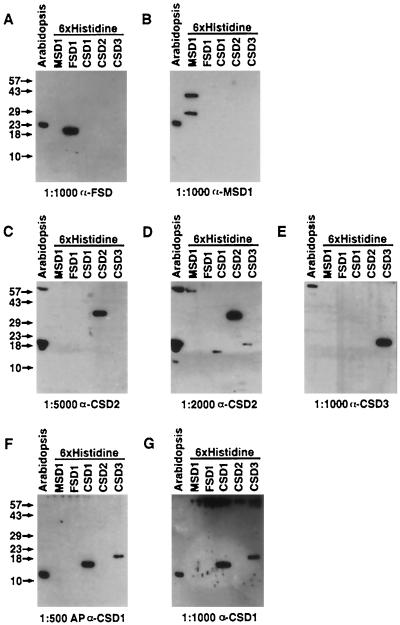
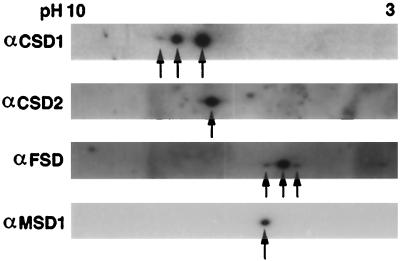
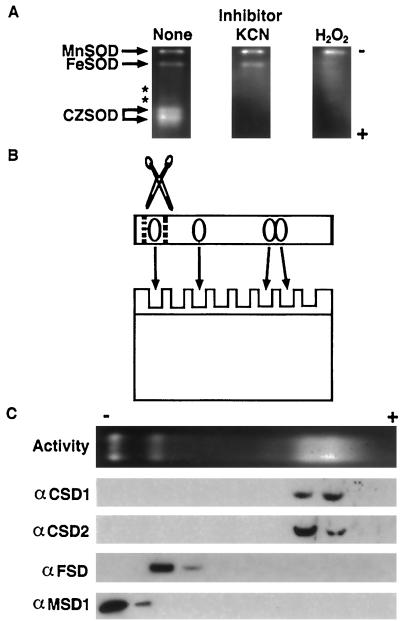
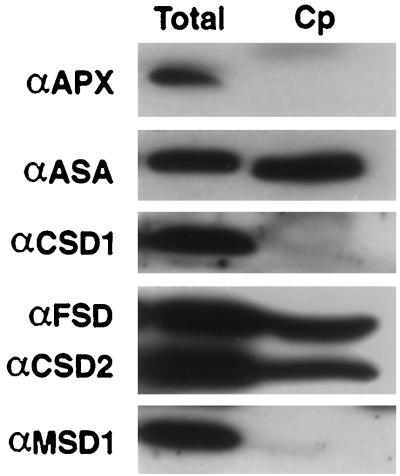
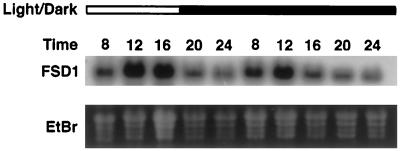
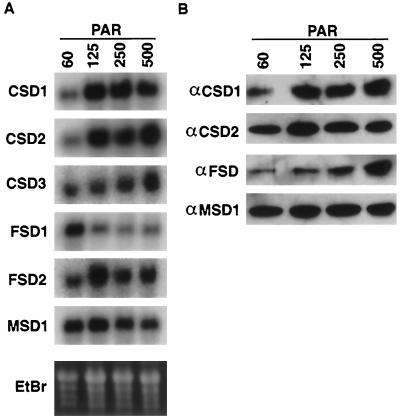
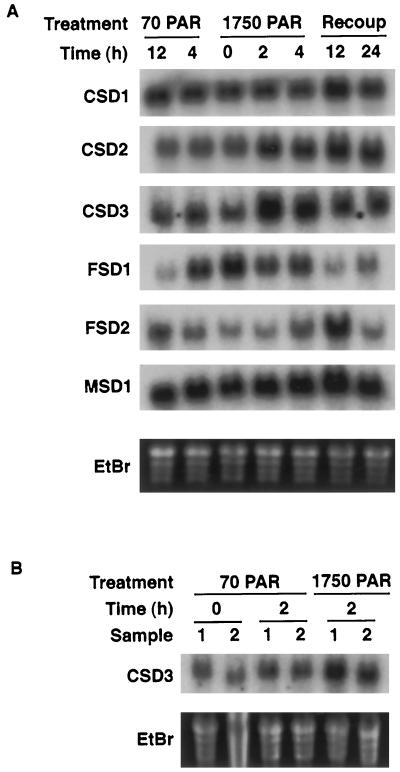
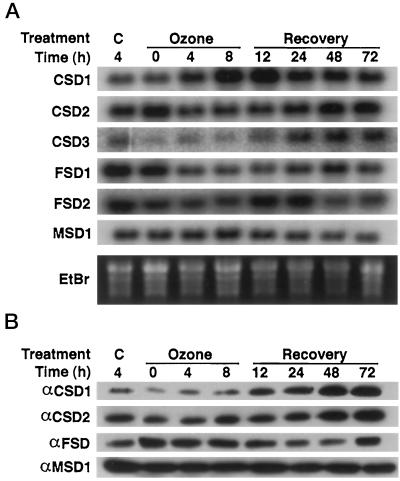
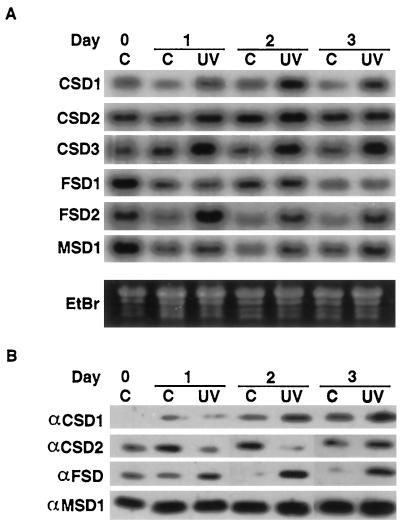
A number of environmental stresses can lead to enhanced production of superoxide within plant tissues, and plants are believed to rely on the enzyme superoxide dismutase (SOD) to detoxify this reactive oxygen species. We have identified seven cDNAs and genes for SOD in Arabidopsis. These consist of three CuZnSODs (CSD1, CSD2, and CSD3), three FeSODs (FSD1, FSD2, and FSD3), and one MnSOD (MSD1). The chromosomal location of these seven SOD genes has been established. To study this enzyme family, antibodies were generated against five proteins: CSD1, CSD2, CSD3, FSD1, and MSD1. Using these antisera and nondenaturing-polyacrylamide gel electrophoresis enzyme assays, we identified protein and activity for two CuZnSODs and for FeSOD and MnSOD in Arabidopsis rosette tissue. Additionally, subcellular fractionation studies revealed the presence of CSD2 and FeSOD protein within Arabidopsis chloroplasts. The seven SOD mRNAs and the four proteins identified were differentially regulated in response to various light regimes, ozone fumigation, and ultraviolet-B irradiation. To our knowledge, this is the first report of a large-scale analysis of the regulation of multiple SOD proteins in a plant species.


Figures

Figure 1
Figure 1
Evolutionary relationships inferred from SOD sequences. Accession numbers for the sequences utilized are listed in Table II. A, Dendrogram of plant CuZnSOD amino acid sequences. The predicted amino acid sequences were analyzed utilizing a DNASTAR (Madison, WI) program, starting at Lys-Ala-Val-Ala-Val-Leu or a homologous sequence to eliminate any amino-terminal transit sequences. B, Alignment of the first 18 amino acids and conserved carboxy-terminal amino acids of the proteins used for the dendogram in A to illustrate cladistic relationships of the plant CuZnSODs. Underlined amino acids indicate a putative peroxisomal targeting sequence. prx, Peroxisome; cyt, cytosol; ec, extracellular. C, Dendogram of FeSOD and MnSOD amino acid sequences. The amino acid sequences were analyzed from the start of homology to the E. coli FeSOD sequence.
Figure 2
Figure 2
Genetic map positions of known Arabidopsis SOD structural genes. The structural genes for the known SOD proteins were mapped to the Arabidopsis genetic map as described in the text. The numbers given are approximate positions on the February 27, 1998 Lister and Dean Recombinant Inbred map for CSD1, CSD2, CSD3, FSD1, FSD2, FSD3, and MSD1 (http://nasc.nott.ac.uk/new_ri_map.html).
Figure 3
Figure 3
Test of SOD antisera specificity. Twenty-five micrograms of total protein from Arabidopsis rosette leaves and 12 ng of the purified 6× His-tagged MSD1, FSD1, CSD1, CSD2, and CSD3 proteins were run on SDS-PAGE and subjected to immunoblot analysis. Postions of molecular-mass markers are listed on the left of each row of gels. The antisera and dilution (v/v) used are listed at the bottom of each gel. AP, Affinity-purified antiserum.
Figure 4
Figure 4
SOD isoelectric variants in Arabidopsis rosette leaves. Twenty-five micrograms of total protein from Arabidopsis rosette leaves was separated by IEF in the first dimension and by SDS-PAGE in the second dimension prior to immunoblot analysis. Arrowheads indicate the SOD isoelectric variants consistently detected.
Figure 5
Figure 5
Characterization of the major Arabidopsis SOD activities. A, Forty micrograms of total protein from Arabidopsis rosette tissue was fractionated on a nondenaturing PAGE gel and stained for SOD activity (clear gel regions). Gels were preincubated with KCN (which inhibits CuZnSOD) or H2O2 (which inhibits both CuZnSOD and FeSOD) to facilitate identification of the different activities. Asterisks mark the location of two minor activities that were seen only occasionally. B, Graphic representation of the experiment shown in Figure 5C. SOD activity gels were cut into slices, the slices were boiled in SDS loading buffer to elute and denature proteins, and aliquots were run on SDS-PAGE and immunodetected. C, Immunoblots of SOD activity gel fractions as illustrated in B. Antisera used are listed to the left.
Figure 6
Figure 6
Copurification of CSD2 and FSD proteins with Arabidopsis chloroplasts. Plastids were purified from rosette leaves, run on SDS-PAGE, and immunodetected with the antisera listed to the left. Cp, Intact chloroplast fraction; Total, total cell extract; APX, ascorbate peroxidase; ASA, anthranilate synthase alpha. Equal protein was loaded based on the level of Rubisco large subunit protein.
Figure 7
Figure 7
Circadian oscillation of FSD1 mRNA. Total RNA was isolated from tissue collected between 8 am and midnight from plants grown for 21 d in a 9-h photoperiod (lights were on from 8 am to 5 pm) and subjected to RNA blot hybridization analysis conducted using an FSD1 cDNA probe. The open bar at the top of the figure represents samples harvested during the illuminated period; the dark bar represents darkness. The time is presented on a 24-h time scale.
Figure 8
Figure 8
Regulation of SOD mRNAs and proteins in response to growth under varied light fluences. Arabidopsis seeds were germinated for 2 d in constant light at 100 μmol m−2 s−1 PAR, and then moved to a different chamber, where the incident light was adjusted to 60, 120, 250, or 500 μmol m−2 s−1 PAR with cheesecloth and nylon mesh. The plants were grown under this fluence for 2 weeks, and tissue was collected for analysis. A, RNA-blot hybridization using the cDNAs listed on the left as probes. B, Immunoblots of protein extracted from plants grown in the same pots that were used for the RNA blots in A. The proteins were immunodetected using the antisera listed.
Figure 9
Figure 9
Regulation of SODs in response to photoinhibitory light. Plants were grown for 2 weeks in 70 μmol m−2 s−1 PAR and exposed to 1750 μmol m−2 s−1 PAR for 4 h. Controls were placed in the same chamber covered with filters to maintain the incident light at 70 μmol m−2 s−1 PAR. All plants were returned to the original chamber for the recovery period. Shown are RNA-blot hybridizations using the cDNAs listed on the left as probes. A, Atmospheric conditions (CO2 at 335–360 μg mL−1); B, CO2 at 2250 μg mL−1.
Figure 10
Figure 10
Regulation of SOD isoenzyme expression in response to ozone fumigation. Plants were fumigated with 330 ppb ozone for 8 h. C represents unfumigated control plants maintained in charcoal-filtered air. The ozone-treated plants were returned to charcoal-filtered air during the recovery period. A, RNA-blot hybridization using the cDNAs listed on the left as probes. B, Immunoblots of protein extracted from plants grown in the same pots as used for the RNA blots in A. The proteins were immunodetected using the antisera listed on the left.
Figure 11
Figure 11
Regulation of SOD isoenzyme expression in response to UV-B. UV-B-treated plants were exposed to 15 kJ of UV-B light. Controls were grown under Mylar filters. Both the controls and the UV-B-treated plants were protected from UV-C by Pyrex glass filters placed over the pots. Samples were harvested directly before starting the UV-B treatment and after 1, 2, and 3 d of treatment. C, −UV-B control samples; UV, UV-B-treated samples. A, RNA-blot hybridization using the cDNAs listed on the left as probes. B, Immunoblots of protein extracted from plants grown in the same pots as used for the RNA blots in A. The proteins were immunodetected using the antisera listed on the left.

References

    1. Alscher RG, Donahue JL, Cramer CL. Reactive oxygen species and antioxidants: relationships in green cells. Physiol Plant. 1997;100:224–233.
    1. Alscher RG, Hess JL. Antioxidants in Higher Plants. Boca Raton, FL: CRC Press; 1993.
    1. Babior BM, El Benna J, Chanock SJ, Smith RM. The NADPH oxidase of leukocytes: The respiratory burst oxidase. In: Scandalios JG, editor. Oxidative Stress and the Molecular Biology of Antioxidant Defenses, Vol 34. Cold Spring Harbor, NY: Cold Spring Harbor Laboratory Press; 1997. pp. 737–783.
    1. Beauchamp C, Fridovich I. Superoxide dismutase: improved assays and assay applicable to acrylamide gels. Anal Biochem. 1971;44:276–287. - PubMed
    1. Bell CJ, Ecker JR. Assignment of 30 microsatellite loci to the linkage map of Arabidopsis. Genomics. 1994;19:137–144. - PubMed

Publication types

Associated data