. 1999 May;73(5):4393-403.
doi: 10.1128/JVI.73.5.4393-4403.1999.

Subtypes of human immunodeficiency virus type 1 and disease stage among women in Nairobi, Kenya

Affiliations

Subtypes of human immunodeficiency virus type 1 and disease stage among women in Nairobi, Kenya

J R Neilson et al. J Virol. 1999 May.

Abstract

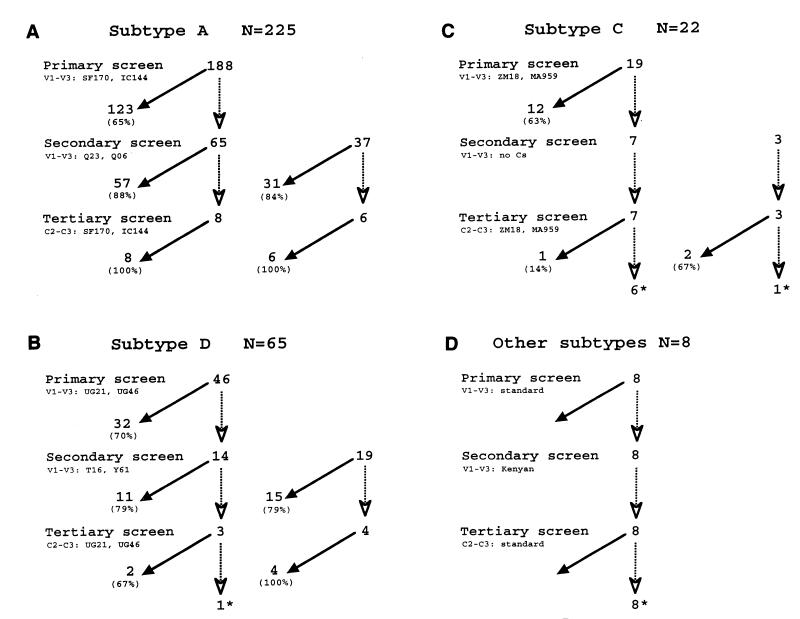
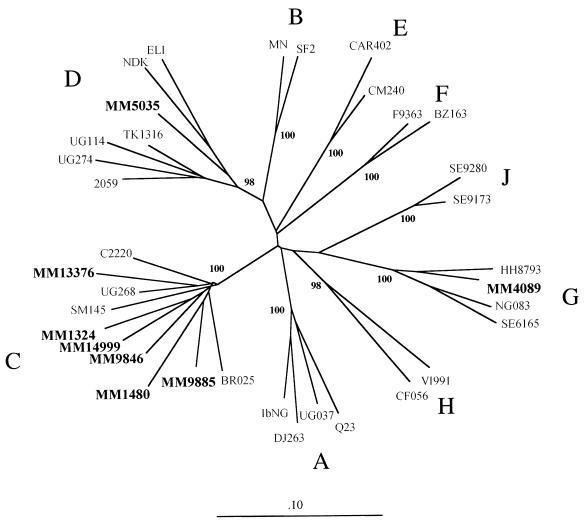
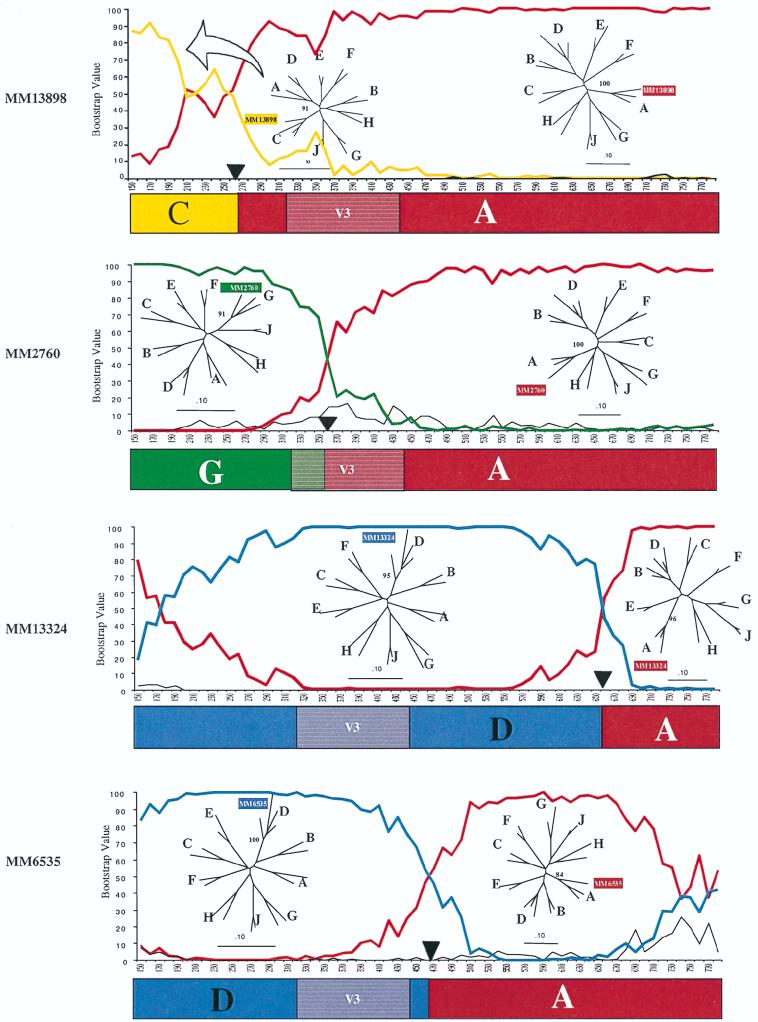
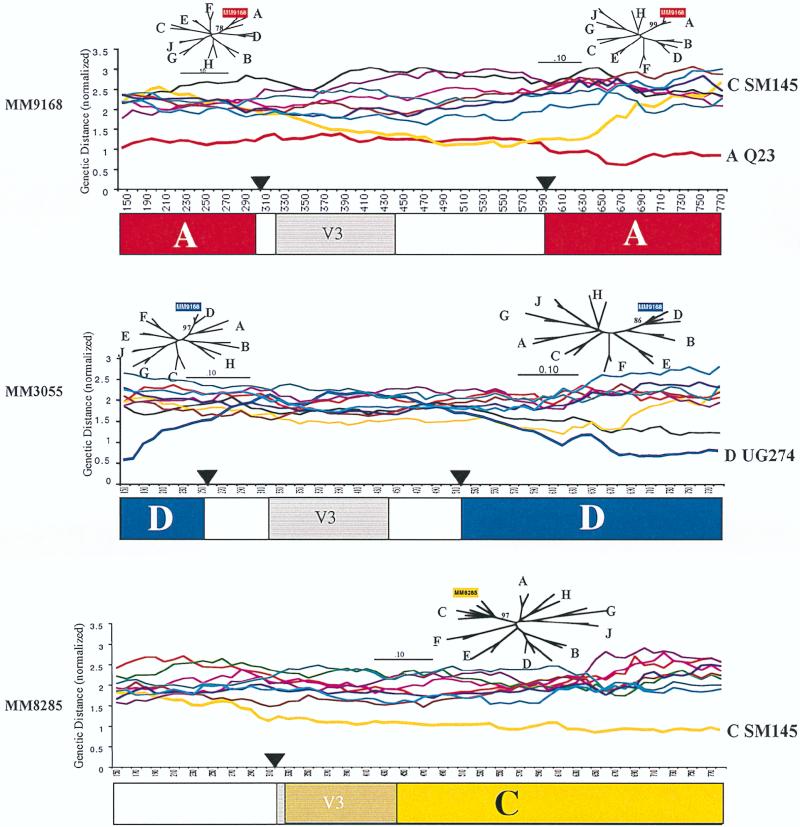
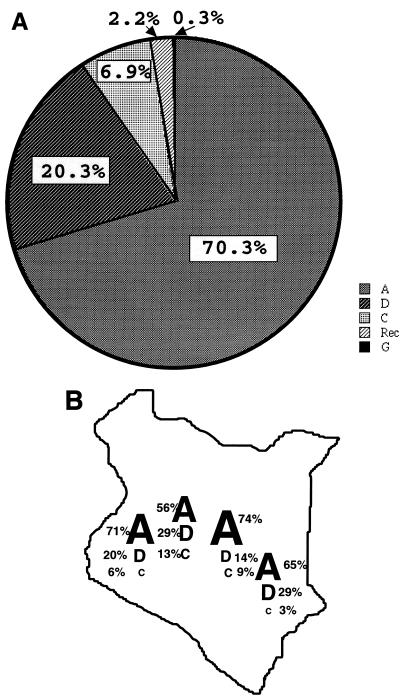
In sub-Saharan Africa, where the effects of human immunodeficiency virus type 1 (HIV-1) have been most devastating, there are multiple subtypes of this virus. The distribution of different subtypes within African populations is generally not linked to particular risk behaviors. Thus, Africa is an ideal setting in which to examine the diversity and mixing of viruses from different subtypes on a population basis. In this setting, it is also possible to address whether infection with a particular subtype is associated with differences in disease stage. To address these questions, we analyzed the HIV-1 subtype, plasma viral loads, and CD4 lymphocyte levels in 320 women from Nairobi, Kenya. Subtype was determined by a combination of heteroduplex mobility assays and sequence analyses of envelope genes, using geographically diverse subtype reference sequences as well as envelope sequences of known subtype from Kenya. The distribution of subtypes in this population was as follows: subtype A, 225 (70.3%); subtype D, 65 (20.5%); subtype C, 22 (6.9%); and subtype G, 1 (0.3%). Intersubtype recombinant envelope genes were detected in 2.2% of the sequences analyzed. Given that the sequences analyzed represented only a small fraction of the proviral genome, this suggests that intersubtype recombinant viral genomes may be very common in Kenya and in other parts of Africa where there are multiple subtypes. The plasma viral RNA levels were highest in women infected with subtype C virus, and women infected with subtype C virus had significantly lower CD4 lymphocyte levels than women infected with the other subtypes. Together, these data suggest that women in Kenya who are infected with subtype C viruses are at more advanced stages of immunosuppression than women infected with subtype A or D. There are at least two models to explain the data from this cross-sectional study; one is that infection with subtype C is associated with a more rapid disease progression, and the second is that subtype C represents an older epidemic in Kenya. Discriminating between these possibilities in a longitudinal study will be important for increasing our understanding of the role of specific subtypes in the transmission and pathogenesis of HIV-1.


Figures

FIG. 1
FIG. 1
Summary flowchart of subtype analysis based on the eventual subtype identified in the sample. The different steps in this analyses included a primary screen using V1 through V3 sequences versus standard reference strains from the AIDS Research and Reference Reagent Program, a secondary screen using V1 through V3 sequences against Kenyan reference strains, and a tertiary screen using a C2-C3 fragment against the standard reference strains, as described in Materials and Methods. The envelope sequences used for HMA are indicated for each subtype, and the number of samples tested against these reference sequences is shown in the flowchart. Samples that were successfully typed at each stage are indicated at the base of a closed arrow, and samples that could not be typed with the indicated sequences are indicated following a dotted line at the base of an open arrowhead. The latter were then tested with the next screen, and the results of this screen are similarly displayed. In cases in which samples were not analyzed with the primary screen, the flowchart begins at the secondary screen, and these samples are shown separately to the right. The percentages that were typed or not typed at each screen are indicated in parentheses. Viral envelope genes that could not be assigned subtypes based on the HMA sequential screening method and required sequence analysis are indicated with asterisks. The results are for subtypes A (A), D (B), and C (C) and recombinants or subtype G (D).
FIG. 2
FIG. 2
Phylogenetic tree of HIV-1 envelope sequences. Phylogenetic analysis was performed as described in Materials and Methods, using C2 through V5 sequences and the subtype references sequences indicated. The number at each node indicates the percentage of bootstrap support as determined from 100 bootstrap resamplings and maximum-parsimony analysis. The phylogenetic tree was built by neighbor-joining analysis. The sequences from this cohort are shown in boldface.
FIG. 3
FIG. 3
Recombination analysis: bootscans. Bootscans were performed as described in Materials and Methods, using subtype A (Q23), subtype C (SM145), subtype D (UG274), and subtype G (HH8793) HIV-1. The analysis included C2 through V5 sequences. Analysis of MM13898 included A (red), C (gold), and D (black). Analysis of MM2760 used A (red), G (green), and D (black). Analyses of MM13324 and MM6535 used A (red), D (blue), and C (black). A black triangle marks the spot where the sequences were separated. The phylogenetic trees are neighbor-joining trees with parsimony bootstrap values at the nodes containing the unknown. Schematics showing the deduced subtype structures are shown below the bootscans. V3, the location of the V3 loop (shown for orientation).
FIG. 4
FIG. 4
Recombination analysis: distance scans. Distance scanning was performed as described in Materials and Methods. The analysis included C2 through V5 sequences. Distances between the unknown and subtypes A (red), B (light blue), C (gold), D (dark blue), E (brown), F (magenta), G (green), H (black), and J (purple) were plotted. The black triangles represent locations where the sequences were broken to run phylogenetic trees. The phylogenetic trees were computed by the neighbor-joining method with parsimony bootstrap values at the nodes with the unknown. The deduced subtype structure of the each virus is shown below the distance scan. Regions in white could not be assigned to any known subtype. V3, the location of the V3 loop (shown for orientation).
FIG. 5
FIG. 5
Summary of the subtype distribution of viruses from the 320 women analyzed. (A) Pie chart of subtype distribution in the overall cohort. The percentage of viruses that belong to each subtype is indicated in the relevant pie section or above it. Rec, recombinant. (B) Geographic distribution of subtypes. The regions of origin were defined on the basis of the ethnicities of the women. This cohort represented ethnic groups from throughout Kenya.

References

    1. Bodrug S, Domingo R, Holloway J, Sanders M, Nunomura K, Sloan C, Billyard B. Gen-Probe single-tube quantitative HIV assay. J Clin Microbiol Infect. 1997;3:1050.
    1. Burke D S, McCutchan F E. Global distribution of human immunodeficiency virus-1 clades. In: Vincent S H, DeVita T Jr, Rosenberg Steven A, editors. AIDS: biology, diagnosis, treatment and prevention. Vol. 4. Philadelphia, Pa: Lippincott-Raven; 1997. pp. 119–126.
    1. Carr J K, Salminen M O, Koch C, Gotte D, Artenstein A W, Hegerich P A, St. Louis D, Burke D S, McCutchan F E. Full-length sequence and mosaic structure of a human immunodeficiency virus type 1 isolate from Thailand. J Virol. 1996;70:5935–5943. - PMC - PubMed
    1. Cornelissen M, Kampinga G, Zorgdrager F, Goudsmit J the UNAIDS Network for HIV Isolation and Characterization. Human immunodeficiency virus type 1 subtypes defined by env show high frequency of recombinant gag genes. J Virol. 1996;70:8209–8212. - PMC - PubMed
    1. Delwart E L, Gordon C J. Tracking changes in HIV-1 envelope quasispecies using DNA heteroduplex analysis. Methods. 1997;12:348–354. - PubMed

Publication types