. 1999 Nov 23;96(24):13863-8.
doi: 10.1073/pnas.96.24.13863.

Intracellular gene transfer in action: dual transcription and multiple silencings of nuclear and mitochondrial cox2 genes in legumes

Affiliations

Intracellular gene transfer in action: dual transcription and multiple silencings of nuclear and mitochondrial cox2 genes in legumes

K L Adams et al. Proc Natl Acad Sci U S A. .

Abstract

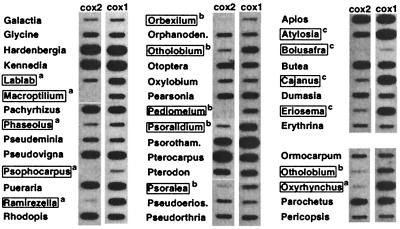
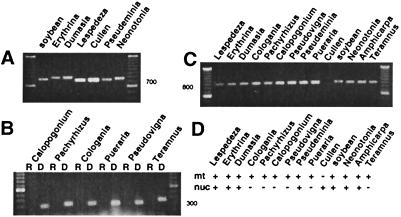
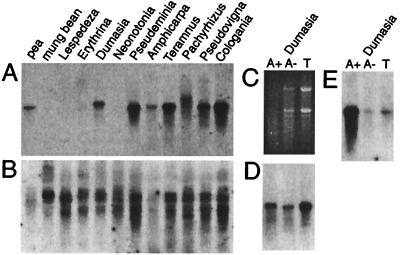
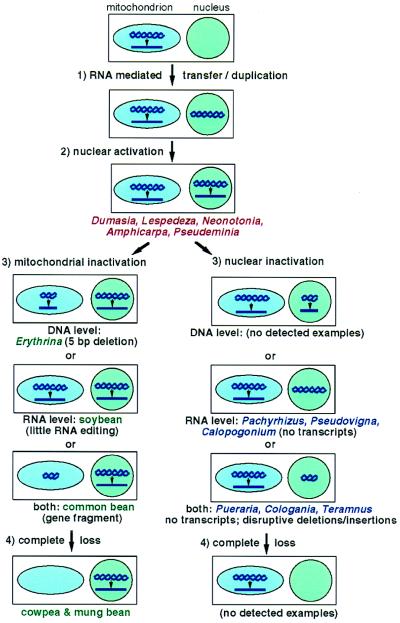
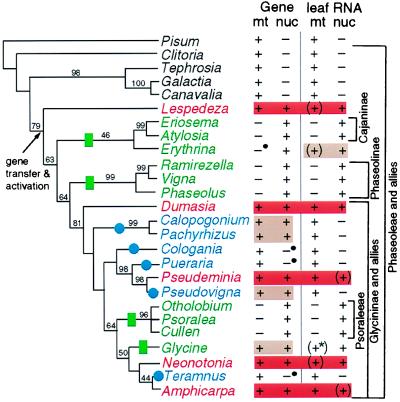
The respiratory gene cox2, normally present in the mitochondrion, was previously shown to have been functionally transferred to the nucleus during flowering plant evolution, possibly during the diversification of legumes. To search for novel intermediate stages in the process of intracellular gene transfer and to assess the evolutionary timing and frequency of cox2 transfer, activation, and inactivation, we examined nuclear and mitochondrial (mt) cox2 presence and expression in over 25 legume genera and mt cox2 presence in 392 genera. Transfer and activation of cox2 appear to have occurred during recent legume evolution, more recently than previously inferred. Many intermediate stages of the gene transfer process are represented by cox2 genes in the studied legumes. Nine legumes contain intact copies of both nuclear and mt cox2, although transcripts could not be detected for some of these genes. Both cox2 genes are transcribed in seven legumes that are phylogenetically interspersed with species displaying only nuclear or mt cox2 expression. Inactivation of cox2 in each genome has taken place multiple times and in a variety of ways, including loss of detectable transcripts or transcript editing and partial to complete gene loss. Phylogenetic evidence shows about the same number (3-5) of separate inactivations of nuclear and mt cox2, suggesting that there is no selective advantage for a mt vs. nuclear location of cox2 in plants. The current distribution of cox2 presence and expression between the nucleus and mitochondrion in the studied legumes is probably the result of chance mutations silencing either cox2 gene.


Figures

Figure 1
Figure 1
Presence of cox2 in mt DNA assayed by slot blot hybridization. Shown are hybridizations of mt cox2 and cox1 probes from soybean to 41 of 392 legume DNAs examined. Boxes designate legumes with diminished or undetectable cox2 hybridization relative to the cox1 control: a, Phaseolinae species (left, and also bottom right), b, Psoraleeae species (middle, and also bottom right), and c, Cajaninae species (top right).
Figure 2
Figure 2
Detection of mt and nuclear cox2 transcripts by RT-PCR. (A) Agarose gel showing RT-PCR products generated by using primers that amplify almost all of the nuclear cox2 targeting sequence plus about half of the mature coding region (700–790 bp). Sizing marker is a 100-bp ladder. (B) RT-PCR and PCR products obtained by using primers that amplify the nuclear cox2 targeting sequence. RT-PCR reactions are indicated by “R” whereas control PCRs using genomic DNA as template are indicated by “D.” (C) RT-PCR products generated by using primers that amplify the entire mt cox2 coding sequence (≈885 bp). (D) Summary of RT-PCR data, indicating the presence (+) or absence (−) of detectable transcripts in the mitochondrion (mt) or nucleus (nuc) of the indicated species.
Figure 3
Figure 3
Levels of cox2 transcripts as determined by Northern hybridizations. (A) High stringency hybridization of a mt cox2 cDNA probe from Amphicarpa to various total RNAs. (B) Rehybridization with a mt cox1 probe from soybean. (C) RNA gel used for hybridizations in D and E. (D) Hybridization of a mt cox2 cDNA probe from Amphicarpa. (E) Rehybridization with an α-tubulin probe from soybean.
Figure 4
Figure 4
A model of the intermediate stages of gene transfer represented by nuclear and mt cox2 in different legumes. Disrupted or fragmented cox2 genes are indicated by a shorter double helix compared with intact genes. Transcription is signified by an arrow and dark line. Names: red indicates dual transcription, green indicates silenced mt cox2, and blue indicates inactivated nuclear cox2; these colors correlate with Fig. 5. See text for explanations of the “DNA level,” “RNA level,” and “both” inactivation categories.
Figure 5
Figure 5
Summary of cox2 gene distribution and transcript data in a phylogenetic context. The left two columns indicate the presence (+) or absence (−) of an intact cox2 gene in the mitochondrion (mt) or nucleus (nuc) of the indicated species. Bullets indicate genes containing small insertions or deletions that disrupt the reading frame or intron splicing. The right two columns indicate the presence (+) or absence (−) of detectable mt and nuclear cox2 transcripts in young leaves. Parentheses indicate transcripts present at low levels; the asterisk indicates transcripts that are not properly edited. Red shading highlights dual (nuclear and mt) transcription and proper processing of dual intact cox2 genes in a given plant; tan indicates dual intact genes or dual transcription, but not both. Nuclear cox2 transcripts in Eriosema, Atylosia, Ramirezella, Psoralea, and Otholobium were not assayed and are inferred from the partial to complete absence of mt cox2 in each plant. Green rectangles and names indicate inactivation of mt cox2 whereas blue circles and names indicate inactivation of nuclear cox2. The phylogenetic tree is one of three equally parsimonious trees obtained from parsimony analysis of a data set consisting of 2,154 bp of two chloroplast gene sequences (rbcL and ndhF) and 557 chloroplast restriction sites. See supplemental material at www.pnas.org for details of this and other analyses. Bootstrap values above 40% are shown.

References

    1. Gray M W. Int Rev Cytol. 1992;141:233–357. - PubMed
    1. Blanchard J L, Schmidt G W. J Mol Evol. 1995;41:397–406. - PubMed
    1. Nugent J M, Palmer J D. Cell. 1991;66:473–481. - PubMed
    1. Covello P S, Gray M W. EMBO J. 1992;22:3815–3820. - PMC - PubMed
    1. Wischmann C, Schuster W. FEBS Lett. 1995;375:152–156. - PubMed

Publication types

Substances

Associated data