Comparative Study
. 2005 May;79(10):6487-504.
doi: 10.1128/JVI.79.10.6487-6504.2005.

Comparative genomics of foot-and-mouth disease virus

Affiliations
Comparative Study

Comparative genomics of foot-and-mouth disease virus

C Carrillo et al. J Virol. 2005 May.

Abstract

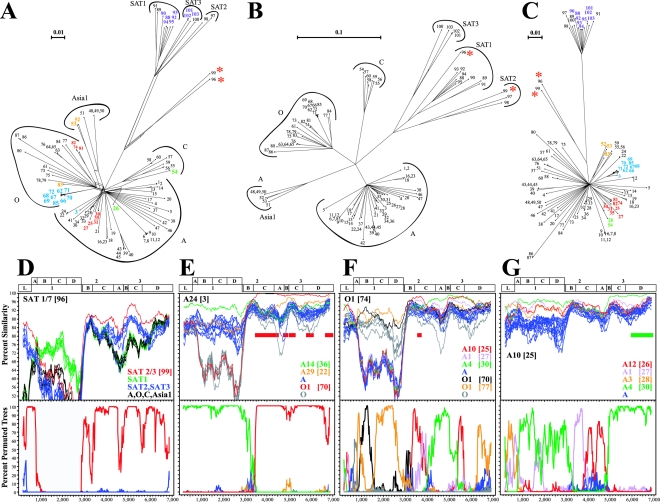
Here we present complete genome sequences, including a comparative analysis, of 103 isolates of foot-and-mouth disease virus (FMDV) representing all seven serotypes and including the first complete sequences of the SAT1 and SAT3 genomes. The data reveal novel highly conserved genomic regions, indicating functional constraints for variability as well as novel viral genomic motifs with likely biological relevance. Previously undescribed invariant motifs were identified in the 5' and 3' untranslated regions (UTR), as was tolerance for insertions/deletions in the 5' UTR. Fifty-eight percent of the amino acids encoded by FMDV isolates are invariant, suggesting that these residues are critical for virus biology. Novel, conserved sequence motifs with likely functional significance were identified within proteins L(pro), 1B, 1D, and 3C. An analysis of the complete FMDV genomes indicated phylogenetic incongruities between different genomic regions which were suggestive of interserotypic recombination. Additionally, a novel SAT virus lineage containing nonstructural protein-encoding regions distinct from other SAT and Euroasiatic lineages was identified. Insights into viral RNA sequence conservation and variability and genetic diversity in nature will likely impact our understanding of FMDV infections, host range, and transmission.


Figures

FIG. 1.
FIG. 1.
FMDV UTR variability. (A) FMDV S and L genomic fragments showing the locations and predicted secondary structures of UTRs. Cn, poly(C) tract; AUG, start codons; pAn, poly(A); I, II, and III, S fragment, IRES, and 3′ UTR, respectively. (B) Rates of substitution per nt between positions 1 and 1218 and positions 8277 and 8441 in a genomic ClustalW alignment. Arrows with numbers indicate positions with high rates of nt substitution. (C) 5′ UTR nt conservation between positions 1 and 1153 for the 103 FMDV isolates examined in this study. Motifs previously defined as conserved between picornavirus IRESs are underlined. Boxes indicate primers used for amplification. Asterisks indicate nt positions tolerant to insertions/deletions in two or more isolates. (D) Nucleotide conservation within S fragment (I), IRES (II), and 3′ UTR (III) predicted secondary structures. Arrows indicate regions used for PCR amplification. UTR regions from the isolate C5Argentina/69 were used to generate secondary structure predictions and plots with mfold and Squiggles. Black circles indicate invariant nt among the 103 isolates presented here; gray circles represent nt that are conserved in at least 100 of 103 isolates (96%); gray shading indicates residues comprising previously described motifs. Nucleotide position numbers correspond to the consensus sequence generated by a ClustalW alignment of the 103 isolates.
FIG. 1.
FIG. 1.
FMDV UTR variability. (A) FMDV S and L genomic fragments showing the locations and predicted secondary structures of UTRs. Cn, poly(C) tract; AUG, start codons; pAn, poly(A); I, II, and III, S fragment, IRES, and 3′ UTR, respectively. (B) Rates of substitution per nt between positions 1 and 1218 and positions 8277 and 8441 in a genomic ClustalW alignment. Arrows with numbers indicate positions with high rates of nt substitution. (C) 5′ UTR nt conservation between positions 1 and 1153 for the 103 FMDV isolates examined in this study. Motifs previously defined as conserved between picornavirus IRESs are underlined. Boxes indicate primers used for amplification. Asterisks indicate nt positions tolerant to insertions/deletions in two or more isolates. (D) Nucleotide conservation within S fragment (I), IRES (II), and 3′ UTR (III) predicted secondary structures. Arrows indicate regions used for PCR amplification. UTR regions from the isolate C5Argentina/69 were used to generate secondary structure predictions and plots with mfold and Squiggles. Black circles indicate invariant nt among the 103 isolates presented here; gray circles represent nt that are conserved in at least 100 of 103 isolates (96%); gray shading indicates residues comprising previously described motifs. Nucleotide position numbers correspond to the consensus sequence generated by a ClustalW alignment of the 103 isolates.
FIG. 2.
FIG. 2.
FMDV coding region variability. (A) Schematic diagram of FMDV polyprotein coding region showing the positions of, from top to bottom, protein-encoding regions (open boxes), cleavage intermediates, and mature proteins (lines). (B) Graphic representation of rates of nt substitution per site as calculated with DNArates software. (C) Graphic representation of nonsynonymous substitutions per site as calculated with SNAP software.
FIG. 3.
FIG. 3.
FMDV invariant amino acids (single letter code). The consensus sequence is based on the comparison of 103 FMDV isolates conducted for this study, with the exception of the 1D region, which also included all 1D sequences available in GenBank (release 141).
FIG. 4.
FIG. 4.
FMDV phylogenetic and recombination analysis. (A) One hundred three FMDV genomes were aligned with ClustalW and visually screened for reticulated branching patterns by split decomposition cluster analysis, using SplitsTree with Hamming distances. Numbers at terminal nodes correspond to the isolates presented in Table 1, arcs and labels indicate serotype-specific groups, similar colors indicate isolates exhibiting obvious interserotypic relationships, red stars indicate SAT viruses with unique nonstructural protein sequences, and bars represent estimated distances. Similar results were obtained with alternative corrections for multiple substitution (data not shown). Subgenomic split decomposition analysis was conducted on structural protein (1A to 1D) (B) and nonstructural protein (Lpro and 2A to 3D) (C) coding regions aligned with Dialign. (D to G) Similarity (upper box) and bootscanning (lower box) plots were generated with a query isolate against reference isolates aligned with Dialign, indicating corrected percent similarities and bootstrap frequencies as percentages of permuted trees, respectively. Polyprotein schematics are shown above the similarity plots. Query isolates are indicated at the left within similarity plots and included the following: (D) SAT 1/7 Isrl 4/62 (no. 96), (E) A24 Argentina/65 (no. 3), (F) O1 M11 (no. 74), and (G) A10 Holland/42 (no. 25). Reference isolates are indicated individually or as groups in color, as labeled at the right within similarity plots, and included the following: (D) red, SAT 2/3 Kenya 11/60 (no. 99); green, SAT1 viruses (no. 88 to 95); blue, SAT2 and SAT3 viruses (no. 97 and 98 and 100 to 103, respectively); black, A viruses (no. 30, 38, and 46), O viruses (no. 80 and 86), C viruses (no. 57), and Asia1 viruses (no. 51); (E) green, A14 Spain/59 (no. 36); orange, A29 Peru/69 (no. 22); blue, A viruses (no. 2, 10, 18, 19, 22, 25, 27, 30, 38, 39, 42, 46, and 47); red, O1 Campos/58 (no. 70); gray, O viruses (no. 74, 78, 80, 83, and 87); (F) red, A10 Holland/42 (no. 25); pink, A1 Bayern/Bavaria (no. 27); green, A4 WG/72 (no. 30); blue, A viruses (no. 2, 10, 18, 19, 22, 38, 39, 42, 46, 47); black O1 Campos/58 (no. 70); orange, O1 Vallee/39 (no. 77); gray, O viruses (no. 63, 75, 77, 78, 80, 83, 87); (G) red, A12 Valle Strain 119 (no. 26); pink, A1 Bayern/Bavaria (no. 27); orange, A3 Mecklenburg/68 (no. 28); green, A4 WG/72 (no. 30); blue, A viruses (no. 2, 3, 5, 10, 13, 17, 19, 21, 22, 29, 32, 33, 36 to 39, 41, 46, and 47). Aligned polyprotein-encoding nt positions are indicated below the bootscan plots. Colored bars within similarity plot boxes indicate fragments identified by GENECONV as having significant global permutation values (P < 0.05) shared between the query sequence and particular reference sequences.

References

    1. Acharya, R., E. Fry, D. Stuart, G. Fox, D. Rowlands, and F. Brown. 1990. The structure of foot-and-mouth disease virus: implications for its physical and biological properties. Vet. Microbiol. 23:21-34. - PubMed
    1. Acharya, R., E. Fry, D. Stuart, G. Fox, D. Rowlands, and F. Brown. 1989. The three-dimensional structure of foot-and-mouth disease virus at 2.9 Å resolution. Nature (London) 337:709-716. - PubMed
    1. Afonso, C. L., E. R. Tulman, Z. Lu, E. Oma, G. F. Kutish, and D. L. Rock. 1999. The genome of Melanoplus sanguinipes entomopoxvirus. J. Virol. 73:533-552. - PMC - PubMed
    1. Agol, V. I., A. V. Paul, and E. Wimmer. 1999. Paradoxes of the replication of picornaviral genomes. Virus Res. 62:129-147. - PubMed
    1. Ambros, V., and D. Baltimore. 1978. Protein is linked to the 5′ end of poliovirus RNA by a phosphodiester linkage to tyrosine. J. Biol. Chem. 253:5263-5266. - PubMed

Publication types

Associated data