. 2001 Oct;67(10):4863-73.
doi: 10.1128/AEM.67.10.4863-4873.2001.

Fluorescent Amplified Fragment Length Polymorphism Analysis of Norwegian Bacillus cereus and Bacillus thuringiensis Soil Isolates

Affiliations

Fluorescent Amplified Fragment Length Polymorphism Analysis of Norwegian Bacillus cereus and Bacillus thuringiensis Soil Isolates

L O Ticknor et al. Appl Environ Microbiol. 2001 Oct.

Abstract

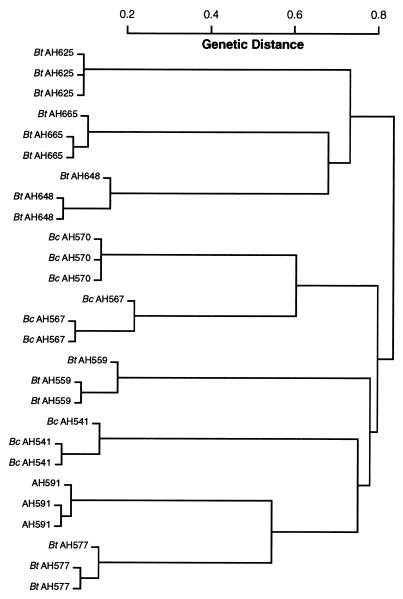
We examined 154 Norwegian B. cereus and B. thuringiensis soil isolates (collected from five different locations), 8 B. cereus and 2 B. thuringiensis reference strains, and 2 Bacillus anthracis strains by using fluorescent amplified fragment length polymorphism (AFLP). We employed a novel fragment identification approach based on a hierarchical agglomerative clustering routine that identifies fragments in an automated fashion. No method is free of error, and we identified the major sources so that experiments can be designed to minimize its effect. Phylogenetic analysis of the fluorescent AFLP results reveals five genetic groups in these group 1 bacilli. The ATCC reference strains were restricted to two of the genetic groups, clearly not representative of the diversity in these bacteria. Both B. anthracis strains analyzed were closely related and affiliated with a B. cereus milk isolate (ATCC 4342) and a B. cereus human pathogenic strain (periodontitis). Across the entire study, pathogenic strains, including B. anthracis, were more closely related to one another than to the environmental isolates. Eight strains representing the five distinct phylogenetic clusters were further analyzed by comparison of their 16S rRNA gene sequences to confirm the phylogenetic status of these groups. This analysis was consistent with the AFLP analysis, although of much lower resolution. The innovation of automated genotype analysis by using a replicated and statistical approach to fragment identification will allow very large sample analyses in the future.


Figures

FIG. 1
FIG. 1
Triplicate AFLP profiles of B. anthracis Vollum. AFLP analysis of B. anthracis Vollum was conducted using EcoRI-C and MseI-G primers. Results were analyzed in three different lanes of a single polyacrylamide gel (A) or on three different polyacrylamide gels (B). Analysis was accomplished on an ABI377 automated DNA sequencer. Only a portion of each profile from 100 to 200 bp is shown. The three different colors represent the three different lanes used for analysis.
FIG. 2
FIG. 2
Phylogenetic analysis of AFLP triplicate samples from different Norway isolates. To demonstrate the reproducibility of sample analysis, AFLP samples for nine different Norway isolates were analyzed on three different polyacrylamide gels. The resulting profiles were then used as the basis for a phylogenetic analysis. AFLP fragments were analyzed, and dendrograms were generated as described in Materials and Methods. The results demonstrate that variability within a sample is far less than AFLP profile differences among different samples.
FIG. 3
FIG. 3
Phylogenetic dendrograms of different B. cereus, B. thuringiensis, and B. anthracis isolates based on AFLP analysis of the samples with EcoRI-C and MseI-G primers. AFLP markers were used as genetic characters to determine the relationships among different Bacillus isolates. AFLP fragments were analyzed and dendrograms were generated as described in Materials and Methods. The distance measure or genetic distance is the fraction of peaks that are different between two samples. The more distance between two nodes of a tree, the more peaks that are different between these two nodes. Isolates are identified as B. thuringiensis or B. cereus based on the H serotype. Branches and symbols on the left of the figure are for reference to Fig. 4, 5, and 6.
FIG. 4
FIG. 4
Phylogenetic dendrogram of different B. cereus, B. thuringiensis, and B. anthracis isolates based on MEE analysis of the samples. MEE data for the different Norwegian isolates generated by Helgason et al. (10) was analyzed by using the same algorithms as used to analyze the AFLP data for these samples. The distance measure or genetic difference is the fraction of the 13 different enzyme alleles that differ among samples. The more distance between two nodes of a tree, the more enzyme alleles are different between those two nodes. Isolates are identified as B. thuringiensis or B. cereus based on the H serotype. Symbols to the left of each sample identify which branch of the AFLP-based dendrogram the sample occupies.
FIG. 5
FIG. 5
The first three principal components of the AFLP analysis fingerprint summaries for the Norwegian isolates are presented. Each isolate was placed into one of five groups based on their clustering on the dendrogram shown in Fig. 3. The five groupings from the first three principal components are analogous to the dendrogram results.
FIG. 6
FIG. 6
Phylogenetic analysis of different B. cereus, B. thuringiensis, and B. anthracis isolates based on differences in 16S rDNA gene sequences. Differences in 16S rDNA sequences among the different isolates were used as genetic characters to determine the relationships among different Bacillus species. DNA sequences were analyzed by using the UPGMA cluster analysis algorithm of the phylogeny analysis using parsimony (PAUP) version 4 software package (26). Analysis was based on 14 different variable nucleotides within a 1,482-bp DNA sequence (Table 2). The numbers on the branches refer to the number of base differences among different isolates.
FIG. 7
FIG. 7
AFLP profiles of three different B. thuringiensis samples sharing the same 16S rDNA gene sequence. AFLP analysis of the samples was conducted using EcoRI-C and MseI-G primers. Resulting DNA fragments were separated on an ABI377 automated DNA sequencer. (A) Profile for B. thuringiensis isolate AH648. (B) Profile for B. thuringiensis isolate AH665. (C) Profile for B. thuringiensis isolate AH678. These three isolates share exactly the same 16S rDNA sequence (Fig. 6 and Table 2). Only a portion of each profile from 260 to 440 bp is shown.

References

    1. Aarts H J M, van Lith L A J T, Keijer J. High-resolution genotyping of Salmonella strains by AFLP-fingerprinting. Lett Appl Microbiol. 1998;26:131–135. - PubMed
    1. Andersen G L, Simchock J M, Wilson K H. Identification of a region of genetic variability among Bacillus anthracis strains and related species. J Bacteriol. 1995;178:377–384. - PMC - PubMed
    1. Ash C, Farrow J A, Dorsch M, Stackebrandt E, Collins M D. Comparative analysis of Bacillus anthracis, Bacillus cereus, and related species on the basis of reverse transcriptase sequencing of 16S rRNA. Int J Syst Bacteriol. 1991;41:343–346. - PubMed
    1. Ash C, Farrow J A E, Wallbanks S, Collins M D. Phylogenetic heterogeneity of the genus Bacillus revealed by comparative analysis of small subunit ribosomal RNA sequences. Lett Appl Microbiol. 1991;13:202–206.
    1. Baumann L, Okamoto K, Unterman B M, Lynch M J, Baumann P. Phenotypic characterization of Bacillus thuringiensis and B. cereus. J Invertebr Pathol. 1984;44:329–341.

Publication types

MeSH terms

LinkOut - more resources