Comparative Study
. 2002 Jun 11;99(12):8324-9.
doi: 10.1073/pnas.062169599.

Novel kingdom-level eukaryotic diversity in anoxic environments

Affiliations
Comparative Study

Novel kingdom-level eukaryotic diversity in anoxic environments

Scott C Dawson et al. Proc Natl Acad Sci U S A. .

Abstract

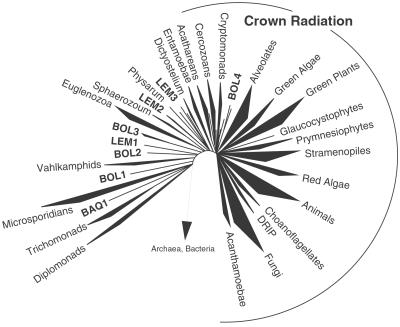
Molecular evolutionary studies of eukaryotes have relied on a sparse collection of gene sequences that do not represent the full range of eukaryotic diversity in nature. Anaerobic microbes, particularly, have had little representation in phylogenetic studies. Such organisms are the least known of eukaryotes and probably are the most phylogenetically diverse. To provide fresh perspective on the natural diversity of eukaryotes in anoxic environments and also to discover novel sequences for evolutionary studies, we conducted a cultivation-independent, molecular phylogenetic survey of three anoxic sediments, including both freshwater and marine samples. Many previously unrecognized eukaryotes were identified, including representatives of seven lineages that are not specifically related to any known organisms at the kingdom-level and branch below the eukaryotic "crown" radiation of animals, plants, fungi, stramenopiles, etc. The survey additionally identified new sequences characteristic of known ecologically important eukaryotic groups with anaerobic members. Phylogenetic analyses with the new sequences enhance our understanding of the diversity and pattern of eukaryotic evolution.


Figures

Figure 1
Figure 1
Summary of unique eukaryotic phylotypes identified in these anoxic environments. A is a summary of the abundance of phylotypes from each of the three anoxic environments surveyed. LEM, freshwater Lake Lemon sediment in Bloomington, IN; BAQ, brackish sediment in Berkeley Aquatic Park, Berkeley, CA; and BOL, marine intertidal sediment from the Bolinas Lagoon, Bolinas, CA, grouped by kingdom-level affiliation. (FUNGI, all fungi, including chytrids; CERCZN, Cercozoa; ACANTH, acanthamoebids; CHOANO, choanoflagellates; NNCRWN, novel, noncrown kingdom-level groups; NCROWN, novel, crown kingdom-level groups; ALVEO, alveolates; STRAM, stramenopiles; ANIMAL, all metazoans). B is a summary of the total number of phylotypes that was identified and grouped by kingdom-level affiliation. All 125 novel sequences were used in these summaries.
Figure 2
Figure 2
Phylogenetic tree of Stramenopiles. This figure depicts a consensus phylogenetic tree of the evolutionary relationships of cultivated and uncultivated stramenopiles and summarizes 100 multiple bootstrapped replicates with two phylogenetic methods (ME and ML; ME, minimum evolution) to infer the tree topologies. Fifty-three representative rRNA sequences incorporating 1,064 unambiguously homologous nucleotide positions were used to infer the phylogenetic trees. The bootstrap values, determined as percentages of 100 trees inferred by each type of analysis, are given for branches with greater than 50% support (ME values shown above lines and ML values shown below). The scale bar indicates 0.10 changes per site. Phototrophic stramenopiles form a phylogenetic group to the exclusion of several deeply branching lineages of heterotrophic stramenopiles.
Figure 3
Figure 3
Phylogenetic tree of Cercozoa. Consensus bootstrapped phylogenetic tree showing evolutionary relationships of uncultivated members of Cercozoa, comprised of cercomonads, testate amoebae, thaumatomonads, and chlorarchaniophytes. Taxa with the designation “LKM” are from a recent molecular survey of a detritus-fed, continuous flow bioreactor (29). Forty-one representative rRNA sequences comprised of 954 unambiguously homologous nucleotide positions were used to create the tree. The bootstrap values, determined as percentages of 100 trees inferred by each type of analysis, are given for branches having greater than 50% support (ME values shown above lines and ML shown values below). The scale bar indicates 0.10 changes per site.
Figure 4
Figure 4
Molecular phylogeny of novel kingdom-level lineages in Eucarya. Consensus phylogenetic tree of representative eucaryal rRNA sequences including novel lineages from these environmental surveys. The tree is a summary of 100 multiple bootstrapped replicates with four phylogenetic methods [maximum parsimony (MP), ME, ML, and Bayesian inference (MB)] to infer the tree topologies. The bootstrap values, determined as percentages of 100 trees inferred by each type of analysis, are given for branches with greater than 50% support, and presented in the order of MP/ME/ML/MB. Bootstrap values for each of the major kingdom-level cultivated and environmental lineages (excluding red algae and Acanthamoebae) also showed greater than 75% bootstrap support with each tree inference method (not shown). Fifty-four representative rRNA sequences incorporating 789 unambiguously homologous nucleotide positions were used in the phylogenetic analyses. The scale bar indicates 0.10 changes per site. Analysis of alternative branching orders of the novel lineages is presented in Table 1.
Figure 5
Figure 5
Schematic diagram of the evolution of Eucarya. Schematic summary tree of global SSU rRNA phylogeny including the novel lineages from the three environments surveyed in this study. The areas of the wedges reflect the number of SSU rRNA sequences of these groups in GenBank. The DRIP lineage is a recently defined protistan clade near the animal–fungal divergences (30). This figure is based on nonparametric bootstrap analyses of MP, ME, and ML trees, Bayesian inferences, and the analysis of alternative likelihood topologies of the novel lineages with the KH likelihood test in the PAUP* package (see Table 1).

References

    1. Philippe H, Lopez P, Brinkmann H, Budin K, Germot A, Laurent J, Moreira D, Muller M, Le Guyader H. Proc R Soc London Ser B Biol Sci. 2000;267:1213–1221. - PMC - PubMed
    1. Hillis D M. Syst Biol. 1998;47:3–8. - PubMed
    1. Poe S. Syst Biol. 1998;47:18–31. - PubMed
    1. Wheeler W. In: Extinction and Phylogeny. Novacek M J, Wheler Q D, editors. New York: Columbia Univ. Press; 1992. pp. 205–215.
    1. Hugenholtz P, Goebel B M, Pace N R. J Bacteriol. 1998;180:4765–4774. - PMC - PubMed

Publication types

Associated data

LinkOut - more resources