. 2002 May 20;195(10):1337-47.
doi: 10.1084/jem.20011868.

Surface cytotoxic T lymphocyte-associated antigen 4 partitions within lipid rafts and relocates to the immunological synapse under conditions of inhibition of T cell activation

Affiliations

Surface cytotoxic T lymphocyte-associated antigen 4 partitions within lipid rafts and relocates to the immunological synapse under conditions of inhibition of T cell activation

Peter J Darlington et al. J Exp Med. .

Abstract

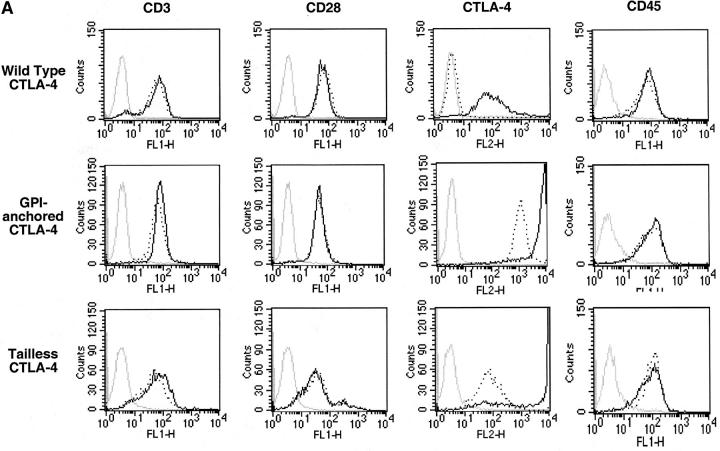
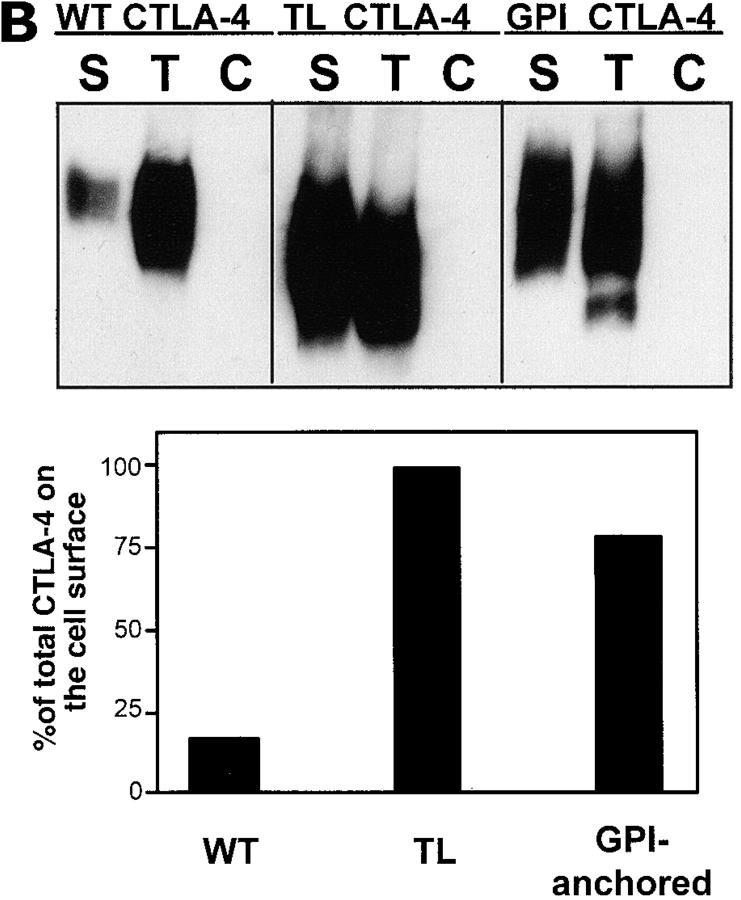
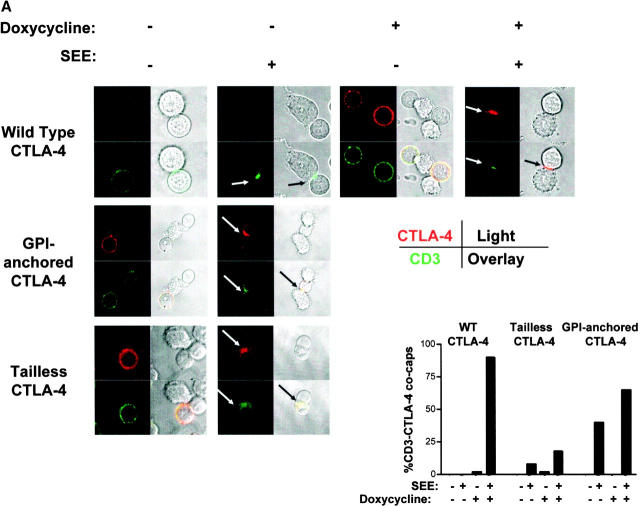
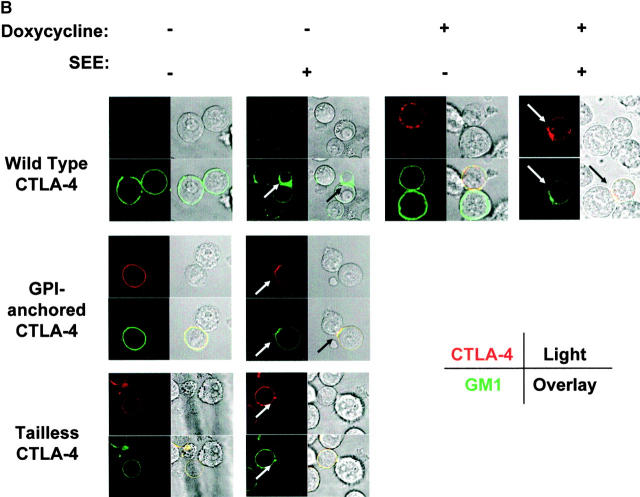
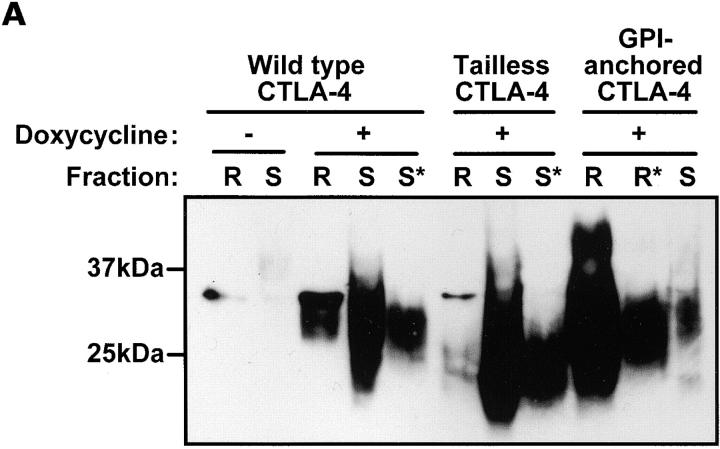
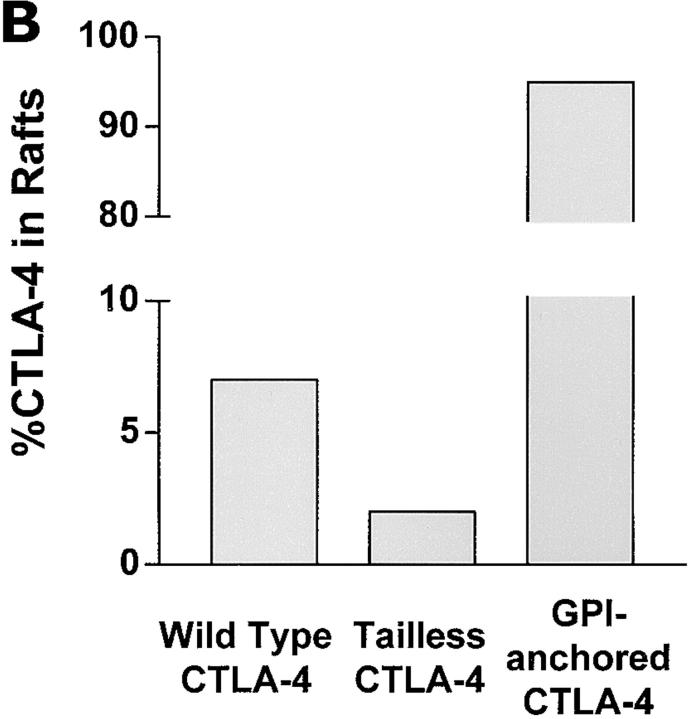
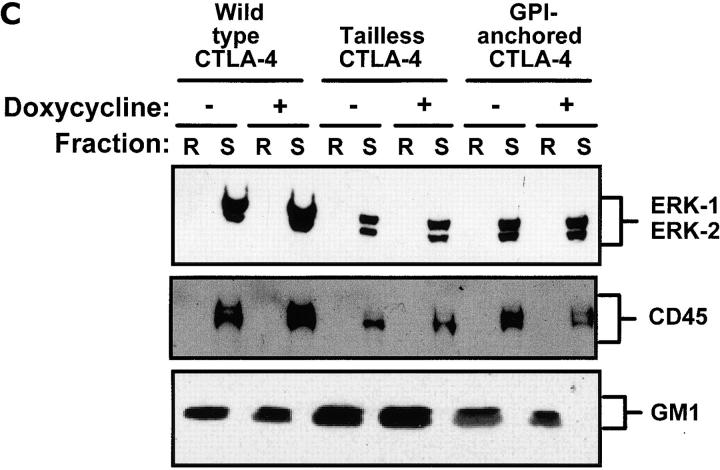
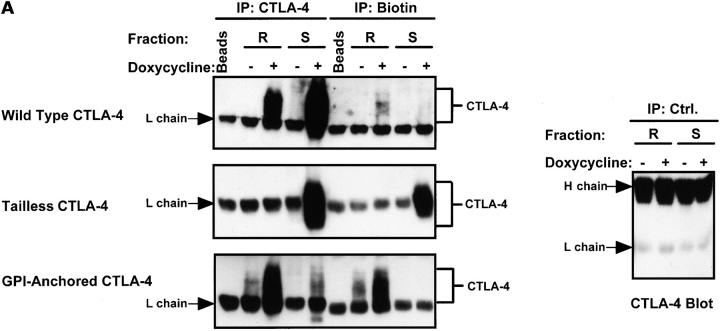
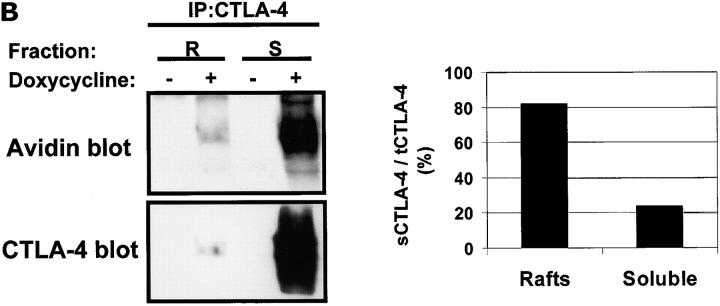
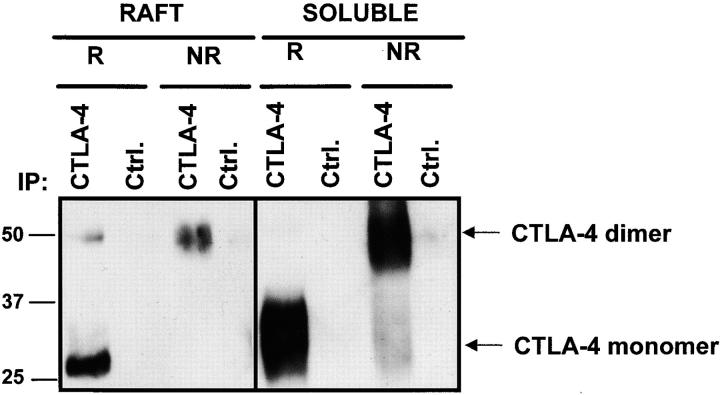
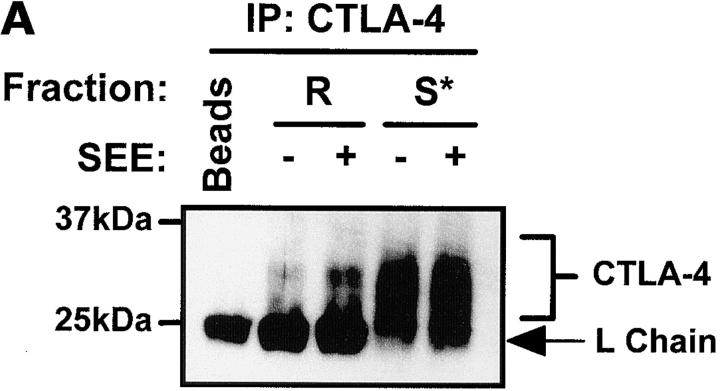
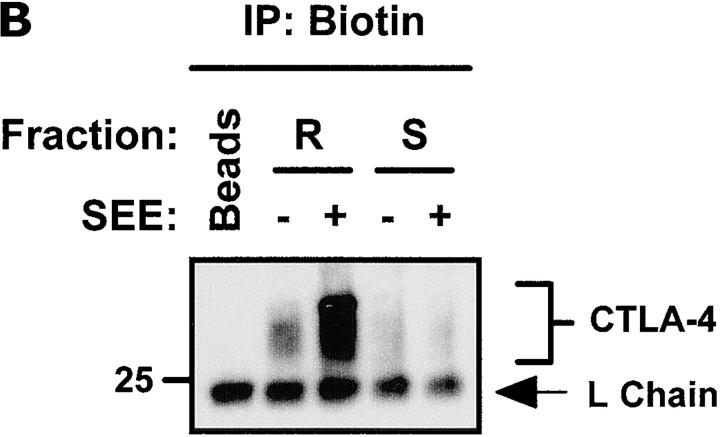
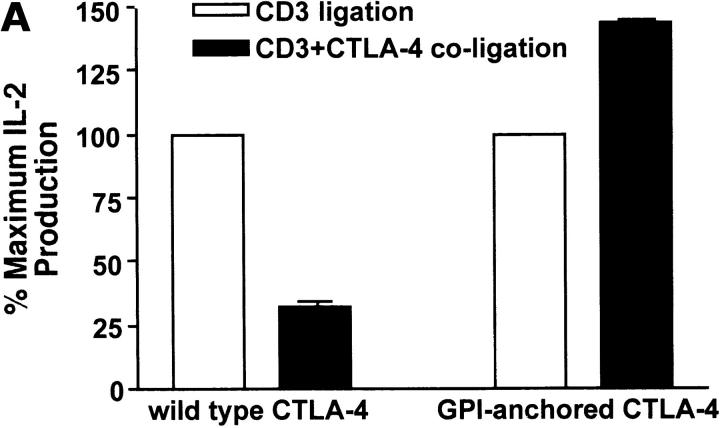
T cell activation through the T cell receptor (TCR) involves partitioning of receptors into discrete membrane compartments known as lipid rafts, and the formation of an immunological synapse (IS) between the T cell and antigen-presenting cell (APC). Compartmentalization of negative regulators of T cell activation such as cytotoxic T lymphocyte-associated antigen-4 (CTLA-4) is unknown. Recent crystal structures of B7-ligated CTLA-4 suggest that it may form lattices within the IS which could explain the mechanism of action of this molecule. Here, we show that after T cell stimulation, CTLA-4 coclusters with the TCR and the lipid raft ganglioside GM1 within the IS. Using subcellular fractionation, we show that most lipid raft-associated CTLA-4 is on the T cell surface. Such compartmentalization is dependent on the cytoplasmic tail of CTLA-4 and can be forced with a glycosylphosphatidylinositol-anchor in CTLA-4. The level of CTLA-4 within lipid rafts increases under conditions of APC-dependent TCR-CTLA-4 coligation and T cell inactivation. However, raft localization, although necessary for inhibition of T cell activation, is not sufficient for CTLA-4-mediated negative signaling. These data demonstrate that CTLA-4 within lipid rafts migrates to the IS where it can potentially form lattice structures and inhibit T cell activation.


Figures

Figure 1.
Figure 1.
Inducible surface expression of wild-type or mutant CTLA-4 on Jurkat T cell clones. (A) Jurkat T cells stably transfected for CTLA-4 on a doxycycline inducible enhancer-promoter. T cells were cultured with 5 μg/ml of doxycycline overnight (solid line) or without it (dotted line), and were analyzed by FACS® for surface expression of CTLA-4, CD3, CD28, and CD45. Shown are representative T cell clones stably transfected with the wild-type CTLA-4 gene, a version of CTLA-4 that lacks the cytoplasmic tail (tailless CTLA-4), and a chimerical molecule consisting of the extracellular domain of CTLA-4 fused to the GPI-anchor of CD58 (GPI-anchored CTLA-4). The staining control is shown in gray. Note that the very high expression of GPI-anchored and tailless CTLA-4 after doxycycline induction is above 104. (B) Percentage of wild-type (WT), tailless (TL), or GPI-anchored CTLA-4 that is expressed on the cell surface. T cell transfectants were biotinylated and underwent immunoprecipitation for biotinylated, i.e., surface, molecules (S), for total CTLA-4 (T), or for an isotype-matched irrelevant antibody control (C), using antibodies covalently cross-linked to beads. These immunoprecipitates were subsequently blotted for CTLA-4. Bands were analyzed by densitometry and plotted as percentage of total CTLA-4 that was biotinylated.
Figure 1.
Figure 1.
Inducible surface expression of wild-type or mutant CTLA-4 on Jurkat T cell clones. (A) Jurkat T cells stably transfected for CTLA-4 on a doxycycline inducible enhancer-promoter. T cells were cultured with 5 μg/ml of doxycycline overnight (solid line) or without it (dotted line), and were analyzed by FACS® for surface expression of CTLA-4, CD3, CD28, and CD45. Shown are representative T cell clones stably transfected with the wild-type CTLA-4 gene, a version of CTLA-4 that lacks the cytoplasmic tail (tailless CTLA-4), and a chimerical molecule consisting of the extracellular domain of CTLA-4 fused to the GPI-anchor of CD58 (GPI-anchored CTLA-4). The staining control is shown in gray. Note that the very high expression of GPI-anchored and tailless CTLA-4 after doxycycline induction is above 104. (B) Percentage of wild-type (WT), tailless (TL), or GPI-anchored CTLA-4 that is expressed on the cell surface. T cell transfectants were biotinylated and underwent immunoprecipitation for biotinylated, i.e., surface, molecules (S), for total CTLA-4 (T), or for an isotype-matched irrelevant antibody control (C), using antibodies covalently cross-linked to beads. These immunoprecipitates were subsequently blotted for CTLA-4. Bands were analyzed by densitometry and plotted as percentage of total CTLA-4 that was biotinylated.
Figure 2.
Figure 2.
CTLA-4 colocalizes in the IS with CD3 and GM1. Wild-type CTLA-4 transfected Jurkat T cells were induced with doxycycline or noninduced and incubated on poly-l-lysine coated confocal dishes with APC plus 100 ng/ml SEE where indicated. Similarly, tailless and GPI-anchored CTLA-4 in the absence of doxycycline (as these cells express significant amounts of CTLA-4 without it) were used. The samples were put on ice to prevent receptor internalization and immunostained for (A) CD3 (green) and CTLA-4 (red) or (B) GM1 (green) and CTLA-4 (red). The samples were then analyzed by confocal microscopy. Co-capping of CD3 and CTLA-4 was scored when both colocalized at the interface between T cell and APC and the cluster stained <50% of the cell surface. At least 100 doublets per group were counted and scored and results are shown at the bottom right of Fig. 2 A. APCs were identified based on their morphology and lack of staining for CTLA-4 and CD3. Light field pictures were taken simultaneously and merged with the color fields. Yellow indicates overlay of red and green signals.
Figure 2.
Figure 2.
CTLA-4 colocalizes in the IS with CD3 and GM1. Wild-type CTLA-4 transfected Jurkat T cells were induced with doxycycline or noninduced and incubated on poly-l-lysine coated confocal dishes with APC plus 100 ng/ml SEE where indicated. Similarly, tailless and GPI-anchored CTLA-4 in the absence of doxycycline (as these cells express significant amounts of CTLA-4 without it) were used. The samples were put on ice to prevent receptor internalization and immunostained for (A) CD3 (green) and CTLA-4 (red) or (B) GM1 (green) and CTLA-4 (red). The samples were then analyzed by confocal microscopy. Co-capping of CD3 and CTLA-4 was scored when both colocalized at the interface between T cell and APC and the cluster stained <50% of the cell surface. At least 100 doublets per group were counted and scored and results are shown at the bottom right of Fig. 2 A. APCs were identified based on their morphology and lack of staining for CTLA-4 and CD3. Light field pictures were taken simultaneously and merged with the color fields. Yellow indicates overlay of red and green signals.
Figure 3.
Figure 3.
Wild-type CTLA-4 is within lipid rafts in a tail-dependent manner. Lipid raft (R) and detergent-soluble (S) fractions were isolated from resting Jurkat T cells transfected with wild-type CTLA-4, tailless CTLA-4, or GPI-anchored CTLA-4 molecules induced with doxycycline or left noninduced. (A) Selected fractions were run on SDS PAGE and Western blotted for CTLA-4. Where indicated by an asterisk (*) the samples were diluted 10-fold with 1× sample buffer before loading in order to assess nonsaturated signals for CTLA-4 in these samples. CTLA-4 is detected as a broad band attributed to differential glycosylation and intermediate GPI-anchored molecules. (B) Band intensities from the film in panel A were quantified by densitometry and used to calculate the percentage of total CTLA-4 within lipid rafts (see Materials and Methods). (C) The fractions used in the experiment (A) were immunoblotted for ERK-1/-2, CD45, and GM1 to control for quality of the separation. ERK-1/-2 and CD45 were found in the soluble fraction while GM1 partitioned within lipid rafts.
Figure 3.
Figure 3.
Wild-type CTLA-4 is within lipid rafts in a tail-dependent manner. Lipid raft (R) and detergent-soluble (S) fractions were isolated from resting Jurkat T cells transfected with wild-type CTLA-4, tailless CTLA-4, or GPI-anchored CTLA-4 molecules induced with doxycycline or left noninduced. (A) Selected fractions were run on SDS PAGE and Western blotted for CTLA-4. Where indicated by an asterisk (*) the samples were diluted 10-fold with 1× sample buffer before loading in order to assess nonsaturated signals for CTLA-4 in these samples. CTLA-4 is detected as a broad band attributed to differential glycosylation and intermediate GPI-anchored molecules. (B) Band intensities from the film in panel A were quantified by densitometry and used to calculate the percentage of total CTLA-4 within lipid rafts (see Materials and Methods). (C) The fractions used in the experiment (A) were immunoblotted for ERK-1/-2, CD45, and GM1 to control for quality of the separation. ERK-1/-2 and CD45 were found in the soluble fraction while GM1 partitioned within lipid rafts.
Figure 4.
Figure 4.
Most lipid raft-associated CTLA-4 is on the cell surface. (A) Wild-type, tailless, and GPI-anchored CTLA-4 T cell transfectants were induced with doxycycline or noninduced, surface biotinylated, and separated into raft and soluble fractions. These fractions were immunoprecipitated for CTLA-4 and for biotin, and Western blotted for CTLA-4. The light chain of the immunoprecipitating antibodies is indicated. The GPI-anchored and tailless CTLA-4 samples were diluted 10-fold before loading on the gel, based on total expression of CTLA-4 to prevent signal saturation. In addition, three times fewer cells were used for tailless CTLA-4 and GPI-anchored CTLA-4 transfectants compared with wild-type CTLA-4 transfectants. Antibody-coated beads rotated in lysis buffer are shown as negative control. Representative isotype-matched control antibody immunoprecipitations (Ctrl.) are shown. (B) CTLA-4 immunoprecipitates of lipid raft and soluble fractions from noninduced and induced, biotinylated wild-type CTLA-4 transfected T cells were sequentially immunoblotted with avidin and with anti–CTLA-4 antibody. Signals were quantified and the ratio of biotinylated CTLA-4 (sCTLA-4) over total CTLA-4 (tCTLA-4) for each fraction plotted in percentage.
Figure 4.
Figure 4.
Most lipid raft-associated CTLA-4 is on the cell surface. (A) Wild-type, tailless, and GPI-anchored CTLA-4 T cell transfectants were induced with doxycycline or noninduced, surface biotinylated, and separated into raft and soluble fractions. These fractions were immunoprecipitated for CTLA-4 and for biotin, and Western blotted for CTLA-4. The light chain of the immunoprecipitating antibodies is indicated. The GPI-anchored and tailless CTLA-4 samples were diluted 10-fold before loading on the gel, based on total expression of CTLA-4 to prevent signal saturation. In addition, three times fewer cells were used for tailless CTLA-4 and GPI-anchored CTLA-4 transfectants compared with wild-type CTLA-4 transfectants. Antibody-coated beads rotated in lysis buffer are shown as negative control. Representative isotype-matched control antibody immunoprecipitations (Ctrl.) are shown. (B) CTLA-4 immunoprecipitates of lipid raft and soluble fractions from noninduced and induced, biotinylated wild-type CTLA-4 transfected T cells were sequentially immunoblotted with avidin and with anti–CTLA-4 antibody. Signals were quantified and the ratio of biotinylated CTLA-4 (sCTLA-4) over total CTLA-4 (tCTLA-4) for each fraction plotted in percentage.
Figure 5.
Figure 5.
CTLA-4 in lipid rafts is homodimeric. Lipid rafts and soluble fractions from doxycycline induced and noninduced wild-type CTLA-4 T cell transfectants were immunoprecipitated for CTLA-4 or an isotype-matched irrelevant control (Ctrl.). Immunoprecipitates were analyzed by SDS PAGE in nonreducing conditions (NR) and reducing (R) conditions, and Western blotted for CTLA-4.
Figure 6.
Figure 6.
The levels of CTLA-4 within lipid rafts increase under conditions of T cell inhibition. (A) Doxycycline-induced, wild-type T cell transfectants were incubated with APC plus or minus 100 ng/ml SEE for 30 min, and separated into lipid raft and soluble fractions. These fractions were immunoprecipitated for CTLA-4 and Western blotted for CTLA-4. The CTLA-4 immunoprecipitations from the soluble fractions were diluted 10-fold to prevent signal saturation. (B) Wild-type T cell transfectants were stimulated as in panel A and then surface biotinylated before raft isolation. Biotinylated proteins were immunoprecipitated from the fractions and Western blotted for CTLA-4. The soluble fractions were not diluted before loading. (C) Wild-type T cell transfectants were stimulated with SEE and APC for 48 h in the absence (−) or presence (+) of doxycycline to induce CTLA-4 expression. The amount of IL-2 in the supernatant was determined by ELISA. (D) Doxycycline induced Jurkat T cells were preincubated with or without anti–human CTLA-4 ScFv F′ab blocking single chain fragment for 30 min. Then, APCs and SEE were added to the cells and IL-2 production was measured after 48 h. Results were statistically significant as analyzed by one-way ANOVA (P < 0.05). (E) Non-induced and doxycycline-induced wild-type–transfected Jurkat T cells were stimulated with APC and SEE for 30 min and CTLA-4 expression on the cell surface was analyzed by flow cytometry. (Non-induced, nonstimulated, control antibody: light dotted line; noninduced, nonstimulated, CTLA-4 stained: thin line; doxycycline-induced, nonstimulated cells: dashed line; doxycycline-induced, stimulated cells: thick line.
Figure 6.
Figure 6.
The levels of CTLA-4 within lipid rafts increase under conditions of T cell inhibition. (A) Doxycycline-induced, wild-type T cell transfectants were incubated with APC plus or minus 100 ng/ml SEE for 30 min, and separated into lipid raft and soluble fractions. These fractions were immunoprecipitated for CTLA-4 and Western blotted for CTLA-4. The CTLA-4 immunoprecipitations from the soluble fractions were diluted 10-fold to prevent signal saturation. (B) Wild-type T cell transfectants were stimulated as in panel A and then surface biotinylated before raft isolation. Biotinylated proteins were immunoprecipitated from the fractions and Western blotted for CTLA-4. The soluble fractions were not diluted before loading. (C) Wild-type T cell transfectants were stimulated with SEE and APC for 48 h in the absence (−) or presence (+) of doxycycline to induce CTLA-4 expression. The amount of IL-2 in the supernatant was determined by ELISA. (D) Doxycycline induced Jurkat T cells were preincubated with or without anti–human CTLA-4 ScFv F′ab blocking single chain fragment for 30 min. Then, APCs and SEE were added to the cells and IL-2 production was measured after 48 h. Results were statistically significant as analyzed by one-way ANOVA (P < 0.05). (E) Non-induced and doxycycline-induced wild-type–transfected Jurkat T cells were stimulated with APC and SEE for 30 min and CTLA-4 expression on the cell surface was analyzed by flow cytometry. (Non-induced, nonstimulated, control antibody: light dotted line; noninduced, nonstimulated, CTLA-4 stained: thin line; doxycycline-induced, nonstimulated cells: dashed line; doxycycline-induced, stimulated cells: thick line.
Figure 7.
Figure 7.
Wild-type CTLA-4, but not GPI-anchored CTLA-4, inhibits IL-2 production upon coligation with the TCR. (A) Wild-type CTLA-4 and GPI-anchored CTLA-4 were incubated with or without 100 ng/ml doxycycline, and incubated with anti-CD3 or anti-CD3 plus anti–CTLA-4 coated beads and soluble anti-CD28 for 48 h. IL-2 in the supernatant was determined by ELISA. The percentage change in IL-2 production in response to anti-CD3 plus anti-CTLA-4 is shown as a bar graph. The response to anti-CD3 beads was taken as 100% for each transfectant. (B) Doxycycline-induced Jurkat T cells were preincubated with or without blocking anti-CTLA-4 ScFv F′ab. After 30 min, beads coated with the indicated antibodies were added to the cells in the presence of soluble anti-CD28 antibodies. IL-2 production was measured after 48 h. Result were statistically significant as analyzed by one-way ANOVA (P < 0.05).
Figure 7.
Figure 7.
Wild-type CTLA-4, but not GPI-anchored CTLA-4, inhibits IL-2 production upon coligation with the TCR. (A) Wild-type CTLA-4 and GPI-anchored CTLA-4 were incubated with or without 100 ng/ml doxycycline, and incubated with anti-CD3 or anti-CD3 plus anti–CTLA-4 coated beads and soluble anti-CD28 for 48 h. IL-2 in the supernatant was determined by ELISA. The percentage change in IL-2 production in response to anti-CD3 plus anti-CTLA-4 is shown as a bar graph. The response to anti-CD3 beads was taken as 100% for each transfectant. (B) Doxycycline-induced Jurkat T cells were preincubated with or without blocking anti-CTLA-4 ScFv F′ab. After 30 min, beads coated with the indicated antibodies were added to the cells in the presence of soluble anti-CD28 antibodies. IL-2 production was measured after 48 h. Result were statistically significant as analyzed by one-way ANOVA (P < 0.05).

References

    1. Bromley, S.K., W.R. Burack, K.G. Johnson, K. Somersalo, T.N. Sims, C. Sumen, M.M. Davis, A.S. Shaw, P.M. Allen, and M.L. Dustin. 2001. The immunological synapse. Annu. Rev. Immunol. 19:375–396. - PubMed
    1. Monks, C.R., H. Kupfer, I. Tamir, A. Barlow, and A. Kupfer. 1997. Selective modulation of protein kinase C-theta during T-cell activation. Nature. 385:83–86. - PubMed
    1. Monks, C.R., B.A. Freiberg, H. Kupfer, N. Sciaky, and A. Kupfer. 1998. Three-dimensional segregation of supramolecular activation clusters in T cells. Nature. 395:82–86. - PubMed
    1. Delon, J., K. Kaibuchi, and R.N. Germain. 2001. Exclusion of CD43 from the immunological synapse is mediated by phosphorylation-regulated relocation of the cytoskeletal adaptor moesin. Immunity. 15:691–701. - PubMed
    1. Shaw, A.S. 2001. FERMing up the synapse. Immunity. 15:683–686. - PubMed

Publication types

MeSH terms

Associated data