

doi: 10.1073/pnas.072090199.
Epub 2002 Mar 26.
Human receptors for sweet and umami taste
Affiliations
- PMID: 11917125
- PMCID: PMC123709
- DOI: 10.1073/pnas.072090199
Item in Clipboard
Human receptors for sweet and umami taste
Proc Natl Acad Sci U S A.
.
Abstract
The three members of the T1R class of taste-specific G protein-coupled receptors have been hypothesized to function in combination as heterodimeric sweet taste receptors. Here we show that human T1R2/T1R3 recognizes diverse natural and synthetic sweeteners. In contrast, human T1R1/T1R3 responds to the umami taste stimulus l-glutamate, and this response is enhanced by 5'-ribonucleotides, a hallmark of umami taste. The ligand specificities of rat T1R2/T1R3 and T1R1/T1R3 correspond to those of their human counterparts. These findings implicate the T1Rs in umami taste and suggest that sweet and umami taste receptors share a common subunit.
Figures
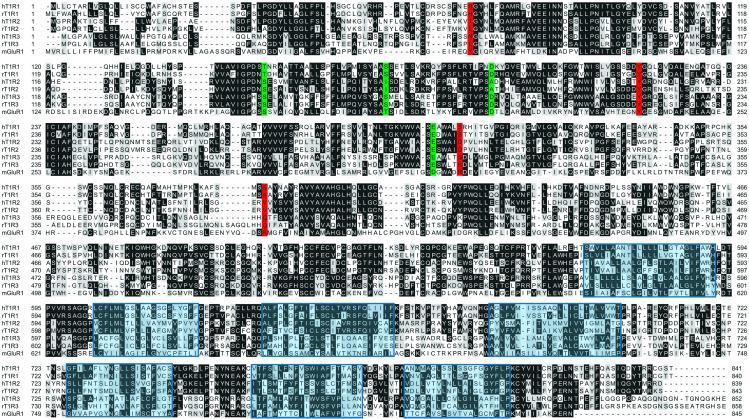
Sequence alignment of human and rat T1Rs. T1R sequences determined in
this study, human T1R1 (GenBank accession no. BK000153), T1R2
(accession no. BK000151), T1R3 (accession no. BK000152), and rat T1R3
(accession no. AF456324), are aligned here with previously described
rat T1Rs (accession nos. AAD18069 and AAD18070) and the rat mGluR1
metabotropic glutamate receptor (accession no. P23385). The mGluR1 C
terminus is not shown. Potential transmembrane segments are boxed in
blue. mGluR1 ligand-binding residues are highlighted following the
color scheme used in Fig. 3A.
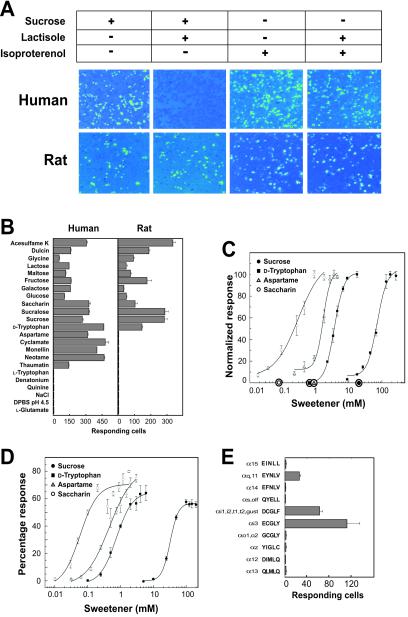
Human and rat T1R2/T1R3 recognize sweet taste stimuli.
(A) Gα15 cells transiently transfected
with human T1R2 and T1R3 and HEK-293T cells transiently transfected
with rat T1R2, T1R3, and Gα15/i1 were assayed for
intracellular calcium increases in response to 300 mM sucrose in the
presence (+) and absence (−) of 1.25 mM lactisole and to 10 nM
isoproterenol in the presence and absence of 1.25 mM lactisole. Each
imaged field shown contains ≈1,000 confluent cells.
(B) The responses of human T1R2/T1R3 and rat
T1R2/T1R3 were determined for sweet taste stimuli at the
concentrations listed in Materials and Methods.
(C) Human T1R2/T1R3 dose responses were determined for
sucrose, d -tryptophan, aspartame, and saccharin. Dose
responses were normalized to the maximal percentage of responding
cells, which ranged from 10 to 40% for different sweeteners. Values
represent the mean ± SE of four independent responses. The
x axis circles represent average psychophysical
detection threshold values for these four sweeteners.
(D) The dose responses of Gα15 cells
stably transfected with human T1R2 and T1R3 were determined for
sucrose, d -tryptophan, aspartame, and saccharin. Responses
are shown as the percentage of fluorescence values relative to
fluorescence increases elicited by 1 μM ionomycin. Values represent
the mean ± SE of four independent responses. (E)
HEK-293T cells were transiently transfected with rat T1R2, rat T1R3,
and each Gα15 chimera, and assayed for intracellular
calcium increases in response to 75 mM sucrose. The five C-terminal
residues of each Gα15 chimera are shown. The activities
in B and E represent the mean ± SE
number of responding cells for four imaged fields of ≈1,000 confluent
cells.
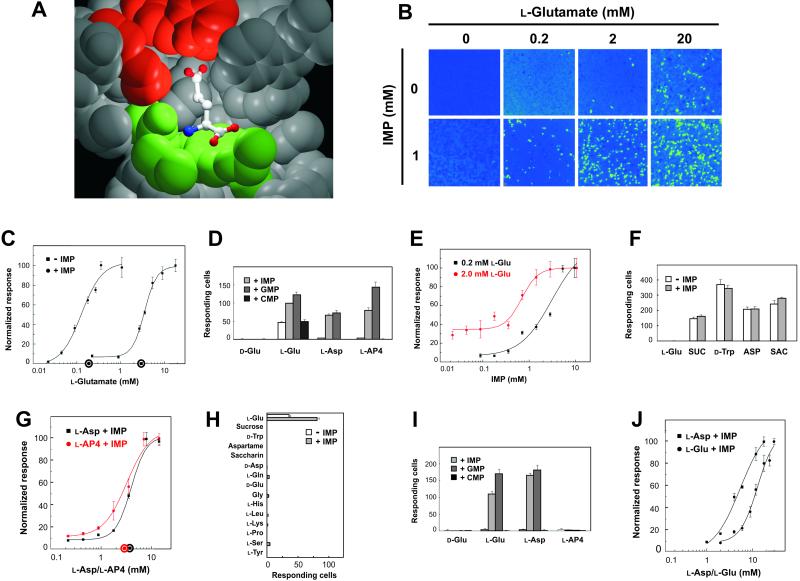
Human and rat T1R1/T1R3 recognize umami taste stimuli.
(A) mGluR1 residues (PDB entry no. 1EWK) that contact
the l -glutamate side chain carboxylate are shown in red,
and residues that contact the l -glutamate α-amino acid
moiety are shown in green. (B) Gα15 cells
transiently transfected with human T1R1 and T1R3 were assayed for
intracellular calcium increases in response to increasing
concentrations of l -glutamate in the presence or absence of
1 mM IMP. Each imaged field shown contains ≈1,000 confluent cells.
(C) Human T1R1/T1R3 dose responses were determined for
l -glutamate in the presence and absence of 0.2 mM IMP. Dose
responses were normalized to the maximal percentage of responding
cells, which was ≈5% for l -glutamate and ≈10% for
l -glutamate plus IMP. Values represent the mean ± SE
of four independent responses. The x axis circles
represent average psychophysical detection threshold values for
l -glutamate in the presence and absence of 0.2 mM IMP.
(D) Human T1R1/T1R3 responses to 25 mM
d -glutamate, 25 mM l -glutamate, 25 mM
l -aspartate, 25 mM l -AP4, and binary mixtures
of these compounds with 2.5 mM IMP, 2.5 mM GMP, or 2.5 mM CMP were
determined. (E) Human T1R1/T1R3 dose responses were
determined for IMP in the presence of 0.2 and 2 mM
l -glutamate and normalized to the maximal percentages of
responding cells, which were ≈10%. Values represent the mean ±
SE of four independent responses. (F) Human T1R2/T1R3
responses to 25 mM l -glutamate, 100 mM sucrose (SUC), 2.5
mM d -tryptophan, 1.5 mM aspartame (ASP), and 0.4 mM
saccharin (SAC) were determined in the presence and absence of 2.5 mM
IMP. (G) Human T1R1/T1R3 dose responses were
determined for l -aspartate and l -AP4 in the
presence of 0.2 mM IMP. Dose responses were normalized to the maximal
percentage of responding cells, which was ≈5% for
l -aspartate plus IMP and ≈10% for l -AP4 plus
IMP. Values represent the mean ± SE of four independent
responses. The x axis circles represent average
psychophysical detection threshold values for l -aspartate
plus 0.2 mM IMP and l -AP4 plus 0.2 mM IMP.
(H) Human T1R1/T1R3 responses to sucrose (100 mM),
d -tryptophan (20 mM), aspartame (2 mM), saccharin (1 mM),
l -tyrosine (5 mM), and d -glutamate,
l -glutamine, d -aspartate, glycine,
l -histidine, l -leucine, l -lysine,
l -proline, and l -serine (each at 10 mM) were
determined in the presence and absence of 1 mM IMP. (I)
HEK-293T cells were transiently transfected with rat T1R1, rat T1R3,
and Gα15/i1 and assayed for increases in intracellular
calcium in response to 25 mM d -glutamate, 25 mM
l -glutamate, 25 mM l -aspartate, 25 mM
l -AP4, and binary mixtures with 2.5 mM IMP, 2.5 mM GMP, or
2.5 mM CMP. (J) Rat T1R1/T1R3 dose responses were
determined for l -aspartate and l -glutamate in
the presence of 0.2 mM IMP. Dose responses were normalized to the
maximal percentage of responding cells, which was ≈10% for
l -aspartate plus IMP and ≈15% for
l -glutamate plus IMP. Values represent the mean ± SE
of four independent responses. The activities in D,
F, H, and I represent the
mean ± SE number of responding cells for four imaged fields of
≈1,000 confluent cells.
References
-
- Hoon M A, Adler E, Lindemeier J, Battey J F, Ryba N J, Zuker C S. Cell. 1999;96:541–551. - PubMed
-
- Kitagawa M, Kusakabe Y, Miura H, Ninomiya Y, Hino A. Biochem Biophys Res Commun. 2001;283:236–242. - PubMed
-
- Max M, Shanker Y G, Huang L, Rong M, Liu Z, Campagne F, Weinstein H, Damak S, Margolskee R F. Nat Genet. 2001;28:58–63. - PubMed
-
- Montmayeur J P, Liberles S D, Matsunami H, Buck L B. Nat Neurosci. 2001;4:492–498. - PubMed
-
- Sainz E, Korley J N, Battey J F, Sullivan S L. J Neurochem. 2001;77:896–903. - PubMed
MeSH terms
Substances
Associated data
- Actions
- Actions
- Actions
- Actions
- Actions
- Actions
LinkOut - more resources
Full Text Sources
Other Literature Sources
Molecular Biology Databases
