. 2000 Dec;10(12):2030-43.
doi: 10.1101/gr.10.12.2030.

Gene discovery using computational and microarray analysis of transcription in the Drosophila melanogaster testis

Affiliations

Gene discovery using computational and microarray analysis of transcription in the Drosophila melanogaster testis

J Andrews et al. Genome Res. 2000 Dec.

Abstract

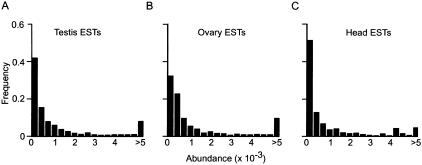
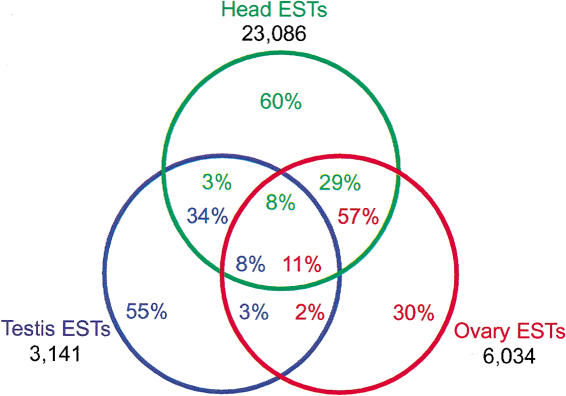
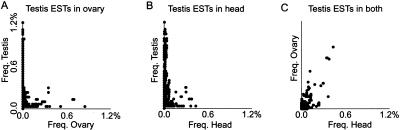
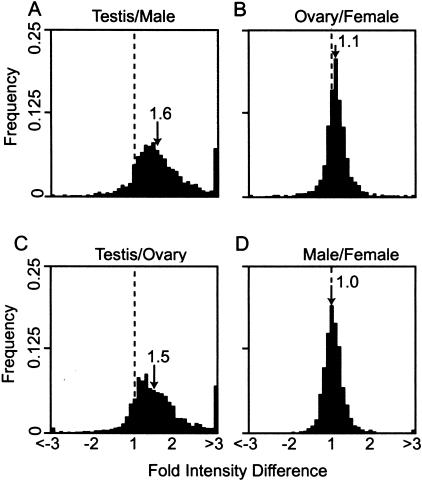
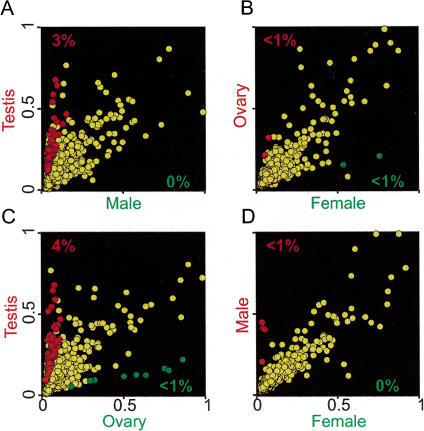
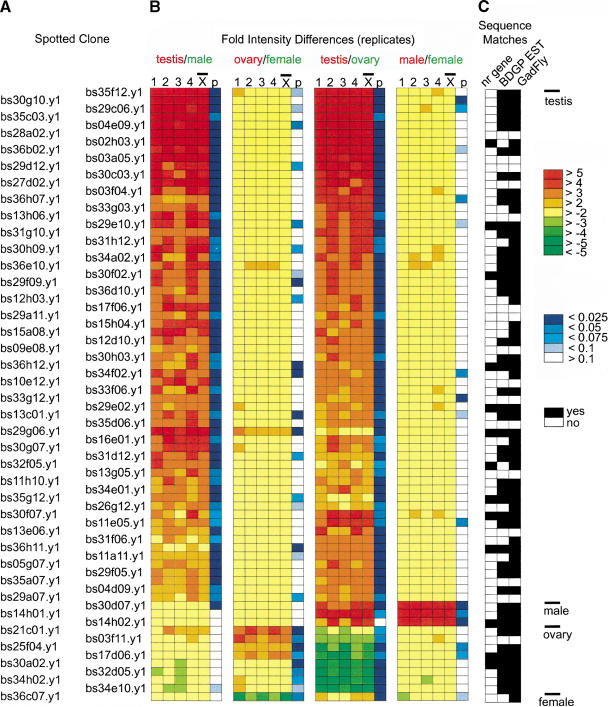
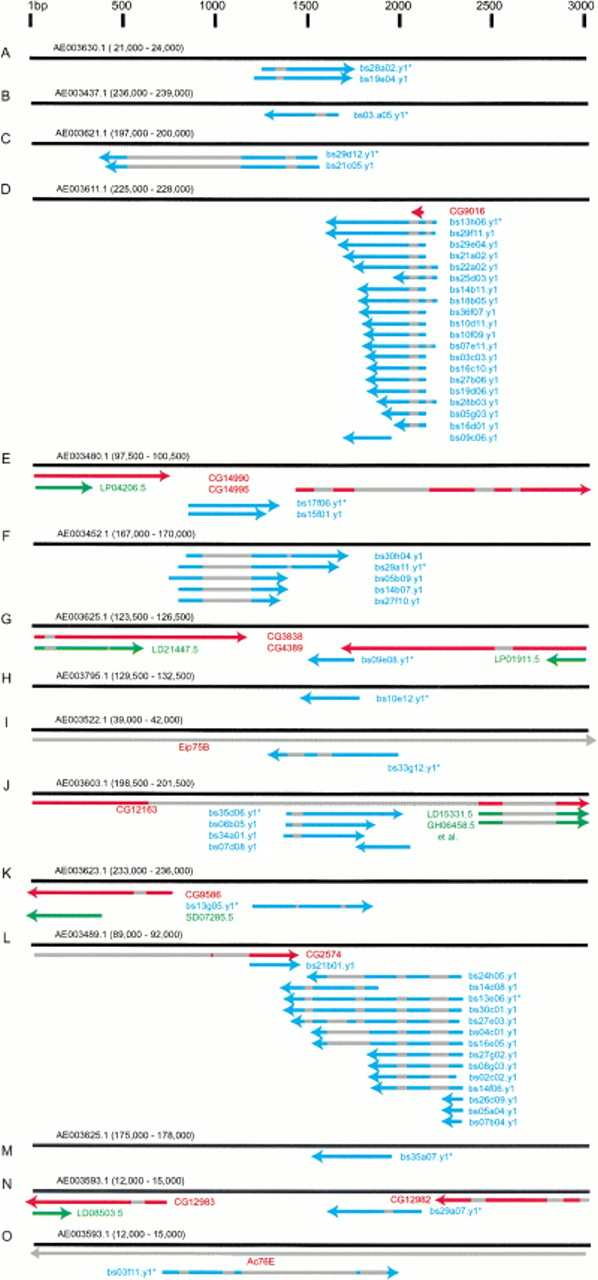
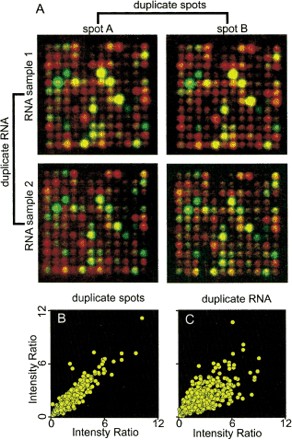
Identification and annotation of all the genes in the sequenced Drosophila genome is a work in progress. Wild-type testis function requires many genes and is thus of potentially high value for the identification of transcription units. We therefore undertook a survey of the repertoire of genes expressed in the Drosophila testis by computational and microarray analysis. We generated 3141 high-quality testis expressed sequence tags (ESTs). Testis ESTs computationally collapsed into 1560 cDNA set used for further analysis. Of those, 11% correspond to named genes, and 33% provide biological evidence for a predicted gene. A surprising 47% fail to align with existing ESTs and 16% with predicted genes in the current genome release. EST frequency and microarray expression profiles indicate that the testis mRNA population is highly complex and shows an extended range of transcript abundance. Furthermore, >80% of the genes expressed in the testis showed onefold overexpression relative to ovaries, or gonadectomized flies. Additionally, >3% showed more than threefold overexpression at p <0.05. Surprisingly, 22% of the genes most highly overexpressed in testis match Drosophila genomic sequence, but not predicted genes. These data strongly support the idea that sequencing additional cDNA libraries from defined tissues, such as testis, will be important tools for refined annotation of the Drosophila genome. Additionally, these data suggest that the number of genes in Drosophila will significantly exceed the conservative estimate of 13,601.


Figures

Figure 1
Figure 1
EST abundance profiles in testis ovary and head. Histograms of EST abundance frequencies. (A) Testis EST set, (B) BDGP ovary EST set, and (C) BDGP head EST set. The abundance of ESTs, measured as the frequency of BLASTN sequence matches within each EST set (x-axis), are plotted against the frequency of ESTs falling within each abundance class (y-axis).
Figure 2
Figure 2
Three-way comparison of sequence matches between the testis, ovary, and head EST sets. All figure elements are color coded. 100% of testis (blue), ovary (red), and head (green) ESTs are within each color coded circle. The total number of ESTs in each collection is indicated. The color coded numbers show the percentage of ESTs from any of the three collections represented in the intersecting segments of the Venn diagram. For example, 60% of head ESTs are represented in only the head EST collection, 3% of head ESTs are represented in the head and testis EST collection, 8% of head ESTs are represented in all three EST collections, and 29% of head ESTs are represented in the head and ovary EST collections.
Figure 3
Figure 3
Frequency scatter plots of testis ESTs also represented in other EST collections. Frequency that a given testis EST is represented in one library is plotted against the frequency that the same testis EST is represented in a second EST collection. (A) Testis frequency versus ovary frequency. (B) Testis frequency versus head frequency. (C) Ovary frequency versus head frequency.
Figure 4
Figure 4
DNA microarray analysis of gene expression in testis, ovaries, males, and females. Frequency histograms of hybridization fold intensity differences, from microarrays printed with testis cDNAs and hybridized with labeled cDNA from (A) testis versus male, (B) ovary versus gonadectomized female, (C) testis versus ovary, and (D) gonadectomized male versus gonadectomized female. The hybridization intensity difference (x-axis) is plotted against the frequency of microarray element falling within each class (y-axis). Where the tissue shown as the numerator resulted in stronger hybridization signal, the intensity difference has a positive value; where the tissue shown as the denominator resulted in a stronger hybridization signal, the intensity difference has a negative value. The broken line indicates where the 1:1 hybridization intensity (no difference) falls on the x-axis. The median intensity difference is given (arrow).
Figure 5
Figure 5
Statistically significant microarray intensity differences. Scatter plots of normalized microarray intensity values averaged from replicate experiments; the arbitrary scale is linear (see Methods). (A) Testis versus gonadectomized male, (B) ovary versus gonadectomized female, (C) testis versus ovary, and (D) gonadectomized male versus gonadectomized female. Individual data points (representing single cDNA microarray elements) that show statistically significant differences, P <0.05, and greater than a threefold intensity difference, are color coded red or green (corresponding to the color coded axis labels). The percentage of array targets satisfying this cutoff are given and are similarly color coded. Data points not satisfying these criteria are yellow.
Figure 6
Figure 6
Summary of statistically significant microarray expression profiles (P <0.05, and threefold intensity difference). (A) Spotted cDNA clone name. (B) Microarray intensity differences from replicate comparisons (1, 2, 3, 4, and mean) of hybridizations with labeled cDNA from the indicated tissues. Tissues are color coded. For a given spotted cDNA, high relative hybridization with labeled “red” cDNA is indicated by red boxes, while high relative hybridization with labeled “green” cDNA is indicated by green boxes. Colorimetric scale is shown on the right. The P values for each spotted cDNA in each experimental series are indicated by blue color coded bars, with the scale shown on the right. The microarray cDNA clones are clustered into those showing testis (62), male (3), ovary (8), or female (1) preferential microarray expression profiles as indicated on the right. (C) A summary of sequence matches between ESTs from the respective microarray cDNAs and the indicated sequence databases. The black and white key is shown on the right (cutoffs are as follows: GenBank nr protein: BLASTX E-value <1E-20, and >90% sequence identity, BDGP ESTs and BDGP/CG predicted genes from the GadFly database: BLASTN E-value <1E-20).
Figure 7
Figure 7
Genomic regions flanking novel, microarray verified, testis transcription units. (A-O) Diagram of sequence alignment between the indicated 3-kb genomic sequences (black bars, coordinates in parentheses, scale at top) and testis ESTs (blue bars), BDGP ESTs (green bars) and known or predicted genes (red bars). The orientation of genes and ESTs are indicated (arrowheads), as are interrupted sequence alignments (gray bars), and the representative clone printed on the microarray (*).
Figure 8
Figure 8
Reproducibility of microarray data. Data from duplicate experiments with radiolabeled cDNA from testis and gonadectomized male. (A) Merged, pseudoclored images of the same subarray from microarrays hybridized with radiolabeled cDNA from testis (red channel) and gonadectomized male (green channel). Duplicate spots are shown in the columns headed spot A and spot B. Results from duplicate experiments (independent tissue, RNA, reverse transcription, and hybridization) are shown in the rows labeled RNA sample 1 and RNA sample 2. (B, C) Scatter plots of hybridization intensity ratios. (B) Scatter plot of hybridization intensity ratios for duplicate spots (r 2= 0.97). (C) Scatter plot of hybridization intensity for duplicate RNA samples (values from duplicate spots were averaged, r2 = 0.68).

Comment in

References

    1. Adams MD, Celniker SE, Holt RA, Evans CA, Gocayne JD, Amanatides PG, Scherer SE, Li PW, Hoskins RA, Galle RF, et al. The genome sequence of Drosophila melanogaster. Science. 2000;287:2185–2195. - PubMed
    1. Adams MD, Kelley JM, Gocayne JD, Dubnick M, Polymeropoulos MH, Xiao H, Merril CR, Wu A, Olde B, Moreno RF, et al. Complementary DNA sequencing: Expressed sequence tags and human genome project. Science. 1991;252:1651–1656. - PubMed
    1. Adams MD, Kerlavage AR, Fleischmann RD, Fuldner RA, Bult CJ, Lee NH, Kirkness EF, Weinstock KG, Gocayne JD, White O, et al. Initial assessment of human gene diversity and expression patterns based upon 83 million nucleotides of cDNA sequence. Nature. 1995;377:3–174. - PubMed
    1. Altschul SF, Madden TL, Schaffer AA, Zhang J, Zhang Z, Miller W, Lipman DJ. Gapped BLAST and PSI-BLAST: A new generation of protein database search programs. Nucleic Acids Res. 1997;25:3389–3402. - PMC - PubMed
    1. Ashburner M. A biologist's view of the Drosophila genome annotation assessment project. Genome Res. 2000;10:391–393. - PubMed

MeSH terms

Associated data