Comparative Study
. 2006 Jul;16(7):815-26.
doi: 10.1101/gr.5016106. Epub 2006 Jun 2.

Genomic organization of the sex-determining and adjacent regions of the sex chromosomes of medaka

Affiliations
Comparative Study

Genomic organization of the sex-determining and adjacent regions of the sex chromosomes of medaka

Mariko Kondo et al. Genome Res. 2006 Jul.

Abstract

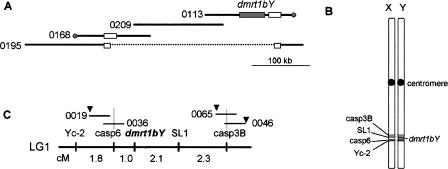
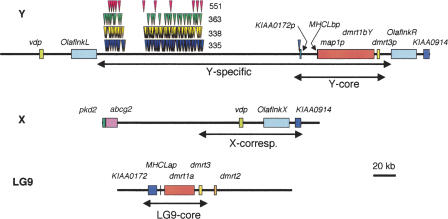
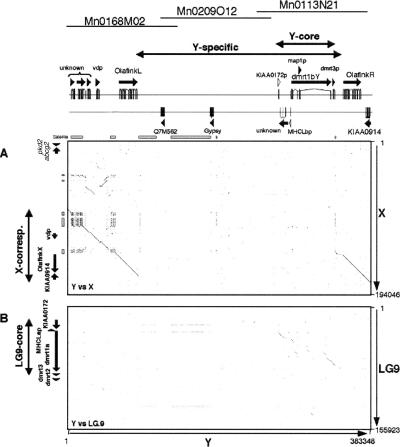
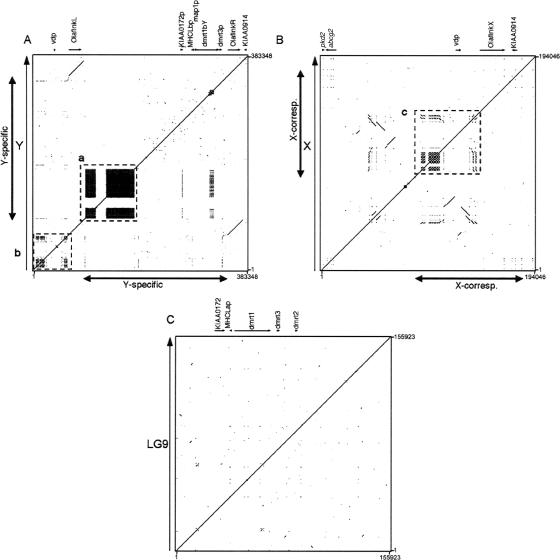
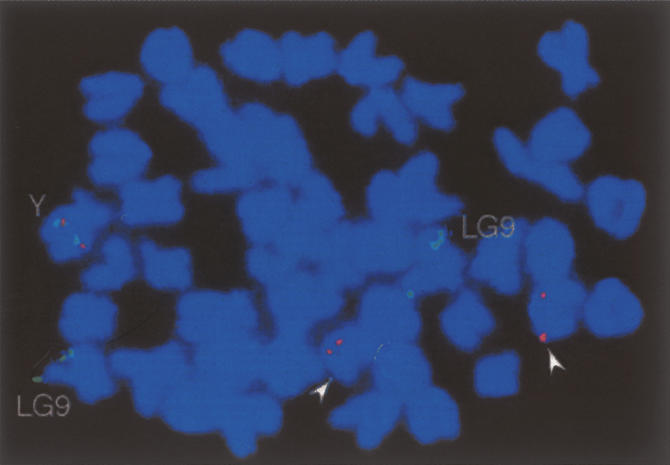
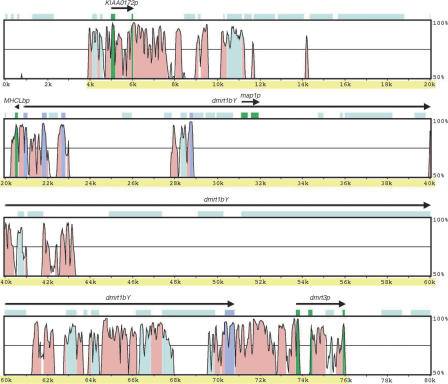
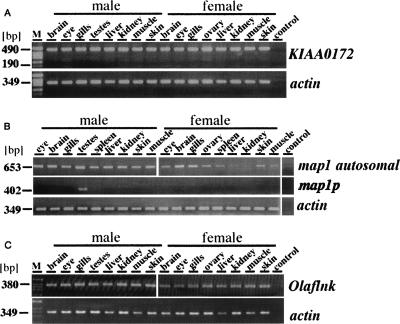
Sequencing of the human Y chromosome has uncovered the peculiarities of the genomic organization of a heterogametic sex chromosome of old evolutionary age, and has led to many insights into the evolutionary changes that occurred during its long history. We have studied the genomic organization of the medaka fish Y chromosome, which is one of the youngest heterogametic sex chromosomes on which molecular data are available. The Y specific and adjacent regions were sequenced and compared to the X. The male sex-determining gene, dmrt1bY, appears to be the only functional gene in the Y-specific region. The Y-specific region itself is derived from the duplication of a 43-kb fragment from linkage group 9. All other coduplicated genes except dmrt1bY degenerated. The Y-specific region has accumulated large stretches of repetitive sequences and duplicated pieces of DNA from elsewhere in the genome, thereby growing to 258 kb. Interestingly the non-recombining part of the Y did not spread out considerably from the original duplicated fragment, possibly because of a large sequence duplication bordering the Y-specific fragment. This may have conserved the more ancestral structure of the medaka Y and provides insights into some of the initial processes of Y chromosome evolution.


Figures

Figure 1.
Figure 1.
The male sex-determining region of medaka and its position on the sex chromosome. (A) The BAC clones covering the sex-determining region of medaka were isolated by screening using dmrt1bY as the probe. The contig was extended by screening the BAC library with BAC end markers in both directions. Mn0168M02 (0168), Mn0209O12 (0209), and Mn0113N21 (0113) on the Y chromosome, as well as Mn0195H08 (0195) from the X chromosome were used for further analysis. The dmrt1bY gene (gray box) is located on clone Mn0113N21. The Olaflnk genes (white boxes) are located on Mn0113N21, Mn0168M02, and Mn0195H08. The gray circles indicate the markers that were derived from BAC end sequences of Mn0168M02 or Mn0113N21, present in Mn0195H08. The dotted line in Mn0195H08 indicates that this region does not exist in this clone, but the flanking regions are present. (B,C) The linkage map close to dmrt1bY. The sex-determining region is located on the long arm of the sex chromosome (LG1). All markers shown in the diagram except for dmrt1bY are present on both the X and Y chromosomes (B). Markers casp6 (caspase 6) and casp3B (caspase 3B) were used to screen the HNI BAC library and Mn0019I23 (0019), Mn0036H11 (0036), Mn0065F06 (0065) and Mn0046N20 (0046) were isolated (not drawn to scale) (C). End-sequencing of these clones revealed the existence of other genes (marked by triangles). Numbers indicate distances in centimorgans in sex-reversed XY female meiosis.
Figure 2.
Figure 2.
Schematic representation of the genomic organization of the sex chromosomes and LG9. Respectively, 383 kb, 194 kb, and 156 kb of the Y chromosome, X chromosome, and LG9 were analyzed. Boxes indicate the predicted coding sequences with similarity to known gene sequences. The red, green, yellow, and blue triangles above the Y-region indicate locations of the Y-specific 551-bp (551), 363-bp (363), 338-bp (338), and 335-bp (335) repeat elements, respectively. In the Y-chromosomal region, vdp, and two copies of Olaflnk, dmrt1bY, and KIAA0914 were identified. In the X-chromosomal BAC clone, pkd2, abcg2, vdp, Olaflnk, and KIAA0914 were identified. The first two genes were only found on the X-chromosomal BAC clone, since the corresponding region on the Y chromosome was not cloned. For gene symbols, see Table 1 and text. The four subregions, the Y-specific region (Y-specific), the region on the Y with identity to LG9 (Y-core), the region on the X corresponding to the sequenced Y chromosome (X-corresponding), and the region on LG9 with similarity to the Y-specific region (LG9-core) are indicated by two-headed arrows.
Figure 3.
Figure 3.
Identities between the X- and Y-chromosomal sequences at the borders of the Y-specific region. The alignment of the border sequences from the Y (first sequence) and X (second sequence) at the left (A) and right ends (B) of the Y-specific region are shown. Asterisks indicate identical nucleotides.
Figure 4.
Figure 4.
Comparison of the Y-chromosomal sequence to the X-chromosomal and LG9 sequences. Genes were identified in the sequenced regions of the sex chromosomes and LG9, represented by arrows along the dot plots. Sequences were compared using the Dotter software. Numbers on the right or at the bottom show the length of the sequences in base pairs. The two-headed arrows indicate the subregions (see legend for Fig. 2). The Y-chromosomal sequence region is compared against the X-chromosomal sequence region in A, and to LG9 in B. (A) The X and Y sequences are aligned at the left and right regions, but not in the middle of the Y region. The Olaflnk genes are delimiting the regions with homology. The sequence of OlaflnkR and the region to the right is aligned without gaps to the X sequence, whereas there are gaps in the alignment left to the OlaflnkL gene. There are also clusters of repetitive sequences in this region. Note that there are two stretches of sequence in this region that are inverted in the X sequence (depicted as two short lines running from left to right, upward). (B) The LG9 sequence cannot be aligned to most of the Y region, but there are some stretches of similarity between the sequences in the dmrt1bY and dmrt3p region.
Figure 5.
Figure 5.
Identification of internal repeat sequences. The Y region (A), X sequence (B), and LG9 sequence (C) were each compared against themselves, and the results are shown as dot plots. (A) The Y-region contains a high number of repetitive elements, as indicated in boxes a and b, the former being specific to the Y-specific region. The Y-specific region is indicated by a two-headed arrow. The two homologous copies of Olaflnk in the Y-region are depicted as two parallel lines. (B) The X sequence also contains repeats, as well as two stretches of sequences present in the reverse direction. The repeats present in box c, upstream of OlaflnkX, are also present in the Y-region, and are plotted in box b in A. The two-headed arrows indicate the X-corresponding region. (C) The LG9 sequence contains no clustered repetitive sequence.
Figure 6.
Figure 6.
Location of repetitive elements found on the Y chromosome. A metaphase from a male fish showing the hybridization signals for dmrt1a and dmrt1bY (green signals), and the repetitive elements (335-bp, 338-bp, 363-bp, and 551-bp repeat) (red signals). These repetitive elements were initially identified on the Y chromosome in the Y-specific region. Red signals are located together with the green signal on the Y chromosome (Y), but are also detected on another pair of acrocentric chromosomes (arrowheads). The green signals at the tip of another pair of chromosomes represent the autosomal (LG9) dmrt1a gene. Consistent with the nucleotide sequence analyses, the repeats are not found on the X chromosome nor colocalize with the autosomal dmrt1a.
Figure 7.
Figure 7.
Comparison of the Y-core and LG9-core sequences. The Y-core sequence (72.1 kb) (shaded yellow) and ∼4 kb each on both sides was compared to the LG9-core sequence (42.9 kb) and ∼5 kb each on both sides using VISTA. The level of conservation (vertical axis) is displayed in the coordinates of the Y-core sequence (horizontal axis). Conserved regions above the level of 70%/100 bp are shaded under the curve, with pink indicating a conserved non-coding region, purple a conserved exon, and green a pseudogene. The light blue shades label the masked sequences using our database.
Figure 8.
Figure 8.
Expression analyses. Expression of genes in the Y-core and LG9-core sequences and Olaflnk was analyzed by RT-PCR. (A) The autosomal KIAA0172 is expressed in all tissues examined. (B) The expression of the autosomal map1 gene was detected in all tissues examined, but in slightly lower amounts in females. Using primers specific for map1p, the presence of transcripts was detected only in the testis. (C) Olaflnk was expressed in all tissues examined. The high identity of the three copies made it impossible to distinguish the transcripts from the three copies. Actin was used to calibrate for RNA amounts; the control is PCR without template.
Figure 9.
Figure 9.
Hypothetical scheme of pairing of X and Y chromosomes during meiosis. Since the X and Y chromosomes are highly homologous, the left and right borders of the Y-specific region could pair, either by the X copy of Olaflnk pairing with the L copy and the Y-specific region, while the R copy and the Y-specific region are looping out, or by OlaflnkX pairing with OlaflnkR, and OlaflnkL and the Y-specific region looping out.

References

    1. Aida T. On the inheritance of color in a fresh-water fish, Aplocheilus latipes Temmick and Schlegel, with special reference to sex-linked inheritance. Genetics. 1921;6:554–573. - PMC - PubMed
    1. Bachtrog D. Sex chromosome evolution: Molecular aspects of Y-chromosome degeneration in Drosophila. Genome Res. 2005;15:1393–1401. - PMC - PubMed
    1. Bachtrog D., Charlesworth B., Charlesworth B. Towards a complete sequence of the human Y chromosome. Genome Biol. 2001;2:reviews1016. - PMC - PubMed
    1. Brunner B., Hornung U., Shan Z., Nanda I., Kondo M., Zend-Ajusch E., Haaf T., Ropers H.H., Shima A., Schmid M., Hornung U., Shan Z., Nanda I., Kondo M., Zend-Ajusch E., Haaf T., Ropers H.H., Shima A., Schmid M., Shan Z., Nanda I., Kondo M., Zend-Ajusch E., Haaf T., Ropers H.H., Shima A., Schmid M., Nanda I., Kondo M., Zend-Ajusch E., Haaf T., Ropers H.H., Shima A., Schmid M., Kondo M., Zend-Ajusch E., Haaf T., Ropers H.H., Shima A., Schmid M., Zend-Ajusch E., Haaf T., Ropers H.H., Shima A., Schmid M., Haaf T., Ropers H.H., Shima A., Schmid M., Ropers H.H., Shima A., Schmid M., Shima A., Schmid M., Schmid M., et al. Genomic organization and expression of the doublesex-related gene cluster in vertebrates and detection of putative regulatory regions for dmrt1. Genomics. 2001;77:8–17. - PubMed
    1. Charlesworth B. Model for evolution of Y chromosomes and dosage compensation. Proc. Natl. Acad. Sci. 1978;75:5618–5622. - PMC - PubMed

Publication types

MeSH terms

LinkOut - more resources