. 2002 Sep;14(9):2175-90.
doi: 10.1105/tpc.003038.

The regulation of actin organization by actin-depolymerizing factor in elongating pollen tubes

Affiliations

The regulation of actin organization by actin-depolymerizing factor in elongating pollen tubes

Christine Y Chen et al. Plant Cell. 2002 Sep.

Abstract

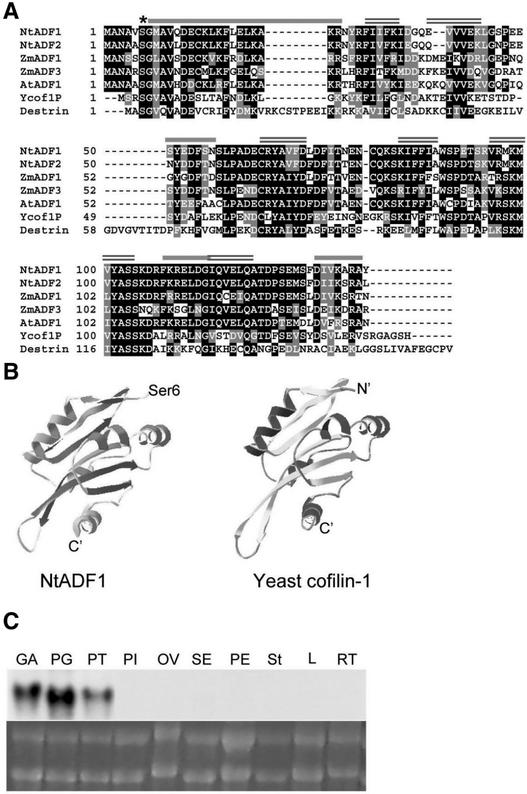
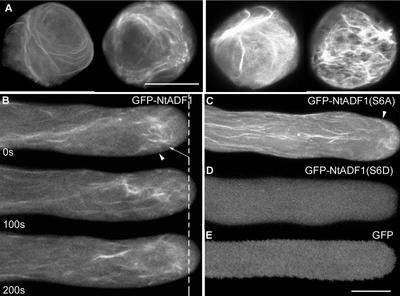
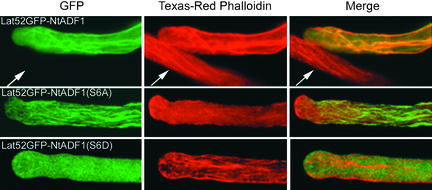
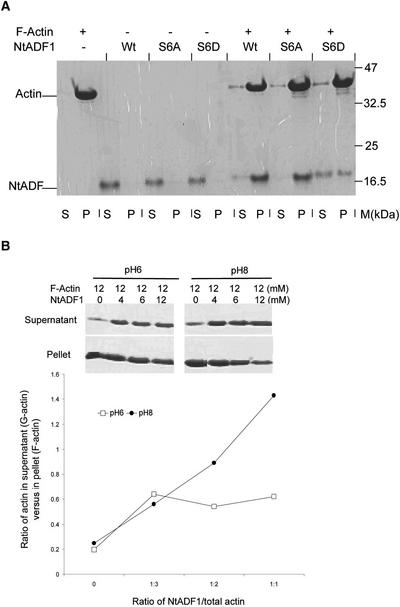
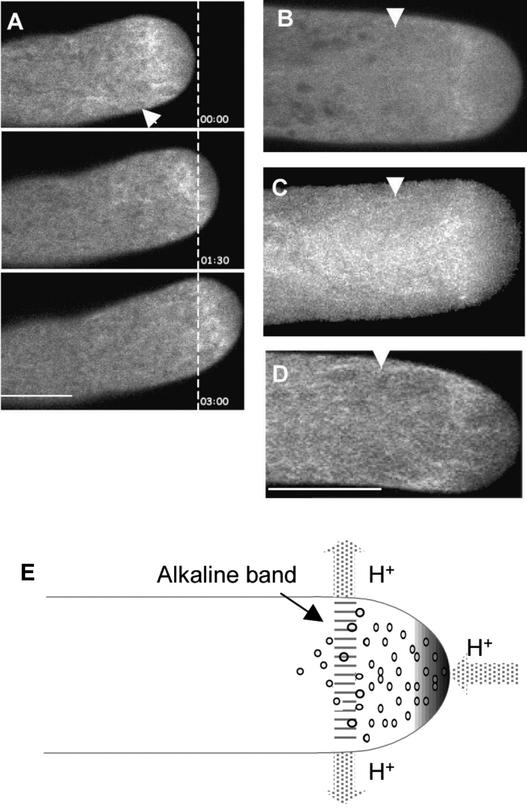
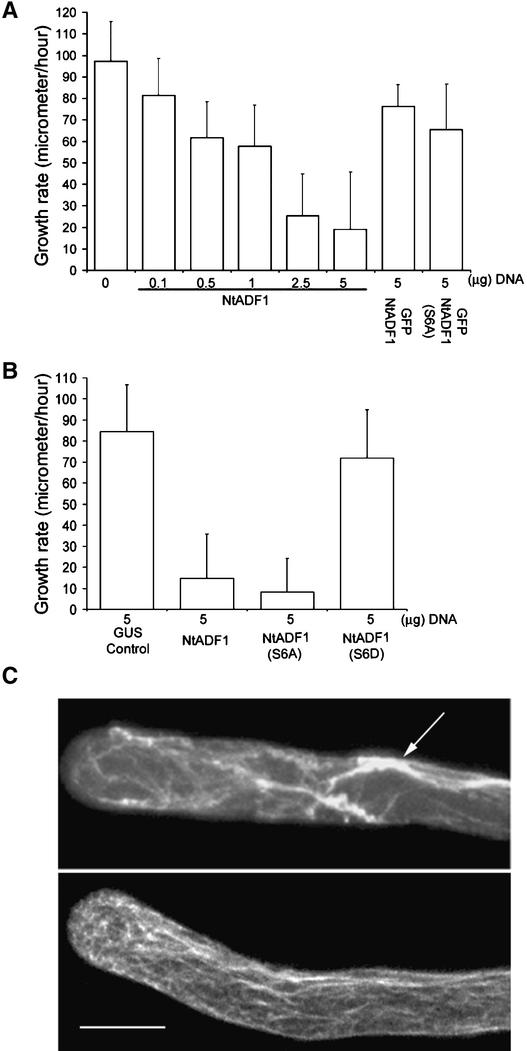
Pollen tube elongation is a polarized cell growth process that transports the male gametes from the stigma to the ovary for fertilization inside the ovules. Actomyosin-driven intracellular trafficking and active actin remodeling in the apical and subapical regions of pollen tubes are both important aspects of this rapid tip growth process. Actin-depolymerizing factor (ADF) and cofilin are actin binding proteins that enhance the depolymerization of microfilaments at their minus, or slow-growing, ends. A pollen-specific ADF from tobacco, NtADF1, was used to dissect the role of ADF in pollen tube growth. Overexpression of NtADF1 resulted in the reduction of fine, axially oriented actin cables in transformed pollen tubes and in the inhibition of pollen tube growth in a dose-dependent manner. Thus, the proper regulation of actin turnover by NtADF1 is critical for pollen tube growth. When expressed at a moderate level in pollen tubes elongating in in vitro cultures, green fluorescent protein (GFP)-tagged NtADF1 (GFP-NtADF1) associated predominantly with a subapical actin mesh composed of short actin filaments and with long actin cables in the shank. Similar labeling patterns were observed for GFP-NtADF1-expressing pollen tubes elongating within the pistil. A Ser-6-to-Asp conversion abolished the interaction between NtADF1 and F-actin in elongating pollen tubes and reduced its inhibitory effect on pollen tube growth significantly, suggesting that phosphorylation at Ser-6 may be a prominent regulatory mechanism for this pollen ADF. As with some ADF/cofilin, the in vitro actin-depolymerizing activity of recombinant NtADF1 was enhanced by slightly alkaline conditions. Because a pH gradient is known to exist in the apical region of elongating pollen tubes, it seems plausible that the in vivo actin-depolymerizing activity of NtADF1, and thus its contribution to actin dynamics, may be regulated spatially by differential H(+) concentrations in the apical region of elongating pollen tubes.


Figures

Figure 1.
Figure 1.
Structure and Expression of NtADF1. (A) Deduced amino acid sequence alignment between NtADF1, NtADF2, Arabidopsis AtADF1, maize pollen ZmADF1, constitutive ZmADF3, yeast cofilin, and human dextrin. The asterisk indicates the Ser-6 residue that has been mutagenized to yield NtADF1(S6A) and NtADF1(S6D). Black shading indicates identity, gray shading indicates similarity, and dashes indicate gaps. Conserved predicted secondary structures (predicted by PREDATOR-EMBL) are shown by overlines: single lines indicate α-helices, and double lines indicate β-sheets. (B) Predicted tertiary structure of NtADF1 (left) (produced by the Swiss-Model program and colored with the Swiss-PBD Viewer) and the determined tertiary structure of yeast cofilin (Federov et al., 1997) (right). (C) RNA gel blot analysis of NtADF1. Comparable levels of total RNA (bottom) were loaded for RNA gel blot analysis. 32P-labeled NtADF1 cDNA was used as a probe for hybridization (top). GA, green anther; PG, pollen grains; PT, pollen tubes; PI, pistil (stigma, style, and ovary); OV, ovary; SE, sepal; PE, petal; St, stigma and style; L, leaf; RT, root.
Figure 2.
Figure 2.
GFP-NtADF1 Associates with Dynamic Actin Bundles in Elongating Pollen Tubes. (A) GFP-NtADF1 labeling pattern in two pollen grains representative of those expressing a moderate level of green fluorescence (left). Two pollen grains representative of those with high levels of GFP-NtADF1 expression are shown (right). Micrographs shown are projections of 1-μm optical sections through the entire grains. Bar = 20 μm. (B) GFP-NtADF1 labeling pattern in an elongating pollen tube representative of those that expressed a moderate level of this fusion protein. Confocal laser scanning images of the same optical section were obtained over a period of 200 s. Time interval is indicated at bottom left in each image. The dotted line indicates the tube tip location at the beginning of the time series. Arrowheads indicate the base of the clear zone, where cytoplasmic streams reversed direction (as observed by differential interference contrast imaging). Arrow indicates the subapical actin mesh. Phalloidin staining of similarly transformed pollen tubes confirmed that the GFP-NtADF1–labeled structures were actin cables (see Figure 3). The streaming pattern of these GFP-NtADF1–labeled cables can be seen in the supplemental data online. (C) Single optical section of a representative GFP-NtADF1(S6A)–expressing pollen tube. (D) Single optical section of a GFP-NtADF1(S6D)–expressing pollen tube. (E) Single optical section of a GFP-expressing pollen tube. Pollen grains and tubes were transformed transiently by microprojectile bombardment. Bar = 10 μm.
Figure 3.
Figure 3.
GFP-NtADF1 Associates with Actin Filaments in Elongating Transformed Pollen Tubes, and Ser-6 Is Important for This Binding. Projections of a Z-series of 1-μm optical sections through entire chemically fixed pollen tubes that expressed GFP-NtADF1 (top row), GFP-NtADF1(S6A) (middle row), or GFP-NtADF1(S6D) (bottom row). These pollen tubes, which were transformed transiently by microprojectile bombardment, elongated normally at the time of chemical fixation, which was followed by Texas red–conjugated phalloidin staining (Doris and Steer, 1996; Vidali et al., 2001). The same pollen tubes are shown in each row. The left column shows GFP fluorescence, the middle column shows red fluorescence from phalloidin binding, and the right column shows a merged image of green and red fluorescence of the same tube. Orange/yellow color indicates colocalization of GFP-NtADF1 and phalloidin. Arrows point to a nontransformed pollen tube showing only red fluorescence from phalloidin binding but no green fluorescence. Note that in the GFP-NtADF1(S6A)–expressing tube, phalloidin binding (middle) was almost entirely excluded.
Figure 4.
Figure 4.
NtADF1 Cosediments with F-Actin. (A) F-actin was mixed with recombinant NtADF1 (Wt), NtADF1(S6A), or NtADF1(S6D) as indicated. After cosedimentation by ultracentrifugation, the pelleted proteins were resuspended in a volume of SDS-PAGE loading buffer equal to that of the supernatant. Equal volumes of these pelleted proteins and proteins in the supernatant were analyzed by 15% SDS-PAGE. This was followed by Coomassie blue staining. M, molecular mass marker; P, pellet; S, supernatant. (B) In vitro NtADF1–depolymerizing activity on F-actin. F-actin and NtADF1 was mixed in the ratios indicated. F- and G-actin were separated by ultracentrifugation. The pelleted proteins and supernatant proteins were treated as described above. The ratio of actin in the supernatant (G-actin) to that in the pellet (F-actin) was determined by densitometry scanning. The gels at top show SDS-PAGE results demonstrating the level of G- and F-actin under different actin/NtADF1 ratios and at two different pH values, 6 and 8. The graph at bottom shows the ratios of G- to F-actin under different NtADF1/actin ratios plotted from this representative experiment. Closed circles, pH 8; open squares, pH 6.
Figure 5.
Figure 5.
GFP-NtADF1 Is Concentrated in an Actin Mesh at the Subapical Region of Elongating Tobacco and Lily Pollen Tubes. (A) Confocal images of a single optical section of the apical region of an elongating tobacco pollen tube expressing GFP-NtADF1 over a period of 180 s. Time interval is shown at lower right in each image. The dashed line indicates the location of the pollen tube tip at the beginning of this time series. Note that the orientation of the GFP-NtADF1–labeled mesh relative to the growth axis remained similar as the pollen tube growth trajectory changed over time. The dynamics within the GFP-NtADF1–labeled mesh can be observed best by viewing the supplemental data online. (B) Confocal image of a single optical section of the apical region of an elongating lily pollen tube expressing GFP-LlADF1. See supplemental data online for a time sequence of this tube. (C) A projection of optical images for an entire elongating lily pollen tube expressing GFP-LlADF1. The effect of growth is reflected by a relatively broad GFP-LlADF1–labeled mesh. The funnel-shaped structure trailing the subapical actin mesh reflects actin filaments that moved basipetally from the actin mesh. (D) An elongating lily pollen tube showing a GFP-talin–labeled actin mesh at the subapical region. See supplemental data online for a time sequence of this tube. (E) Scheme showing the distribution of H+ fluxes (arrows) around a lily pollen tube tip region. A tip-focused H+ gradient is shown, and increasing shading intensity indicates increasing concentration. An alkaline band (reported to be approximately pH 7.5, relative to a tip pH of 6.5) has been located within and close to the base of the clear zone (Feijo et al., 1999). All pollen tubes shown in (A) to (D) were transformed transiently by microprojectile bombardment. Arrowheads at top in (A) to (D) point to the base of the clear zone as observed under differential interference contrast imaging. Small dots in (E) indicate secretory vesicles in the clear zone. Bar in (A) = 10 μm; bar in (D) = 20 μm for (B) to (D).
Figure 6.
Figure 6.
Overexpression of NtADF1 Inhibits Pollen Tube Growth in Transiently Transformed Pollen Tubes. (A) and (B) Pollen tube growth rates between 5 and 8 h of growth after germination. Pollen was transformed with the indicated amounts of different chimeric genes used. In (A), except for the GFP-NtADF1 and GFP-NtADF1(S6A) samples, all pollen grains were cobombarded with 5 μg of Lat52-GFP as a marker for transformation and to assess for comparable transgene expression in all samples. In samples in which <5 μg of experimental chimeric gene was used, Lat52–β-glucuronidase (GUS) DNA was added to make up to 10 μg of DNA used for every transformation. This ensured that equal amounts of DNA were coated onto tungsten particles and introduced into the pollen samples. (C) Projection of Z-series images of 5-h-old pollen tubes that had been transformed with 5 μg of Lat52-GFP and 5 μg of Lat52-NtADF1 (top) or with the same amounts of Lat52-GFP and Lat52–β-glucuronidase (bottom; control), fixed, and stained with Texas red–conjugated phalloidin. Lat52-GFP served as a marker for transformation. The arrow points to thick phalloidin-bound actin bundles. Bar = 10 μm.
Figure 7.
Figure 7.
GFP-NtADF1 Localization Pattern in Transformed Pollen Tubes Elongating in the Pistil. (A) Epifluorescence image of a representative stigma that had been pollinated with control GFP-expressing pollen grains. Only a few ungerminated grains remained, as occurs normally in all pollination. The nonfluorescent grains represent the empty grains whose cytoplasm had migrated with the pollen tube tip into the lower half of the style. (B) Epifluorescence images of two representative stigmas that had been pollinated with GFP-NtADF1–expressing pollen grains. A larger number of short pollen tubes remained in the stigmatic regions relative to the control. (C) Hydrated GFP-NtADF1–expressing pollen grain on the stigma. (D) Two representative short GFP-NtADF1–expressing pollen tubes from the stigmatic region. (E) Three representative GFP-NtADF1–expressing pollen tubes that had extended into the bottom half of pollinated styles. (F) A control GFP-expressing pollen tube that had extended into the bottom half of a pollinated style showing only diffuse fluorescent signal. Arrows point to the subapical region with a concentration of GFP-NtADF1. Arrowheads point to actin cables in the shank. Bars in (A) to (C) = 100 μm; bar in (E) = 10 μm for (D) to (F).

References

    1. Agnew, B.J., Minamide, L.S., and Bamburg, J.R. (1995). Reactivation of phosphorylated actin depolymerizing factor and identification of the regulatory site. J. Biol. Chem. 270, 17582–17587. - PubMed
    1. Aizawa, H., Fukui, Y., and Yahara, I. (1997). Live dynamics of Dictyostelium cofilin suggests a role in remodeling actin latticework into bundles. J. Cell Sci. 110, 2333–2344. - PubMed
    1. Aizawa, H., Suton, K., and Yahara, I. (1996). Overexpression of cofilin stimulates bundling of actin filaments, membrane ruffling, and cell movement in Dictyostelium. J. Cell Biol. 132, 335–344. - PMC - PubMed
    1. Ausubel, F.M., Brent, R., Kingston, R.E., Moore, D.D., Seidman, J.G., Smith, J.A., and Struhl, K. (2000). Current Protocols in Molecular Biology. (New York: John Wiley & Sons).
    1. Bamburg, J.R. (1999). Proteins of the ADF/cofilin family: Essential regulators of actin dynamics. Annu. Rev. Cell Biol. 15, 185–230. - PubMed

Publication types

MeSH terms

Associated data