

U.S. Human immunodeficiency virus type 1 epidemic: date of origin, population history, and characterization of early strains
- PMID: 12743293
- PMCID: PMC155028
- DOI: 10.1128/jvi.77.11.6359-6366.2003
U.S. Human immunodeficiency virus type 1 epidemic: date of origin, population history, and characterization of early strains
Abstract
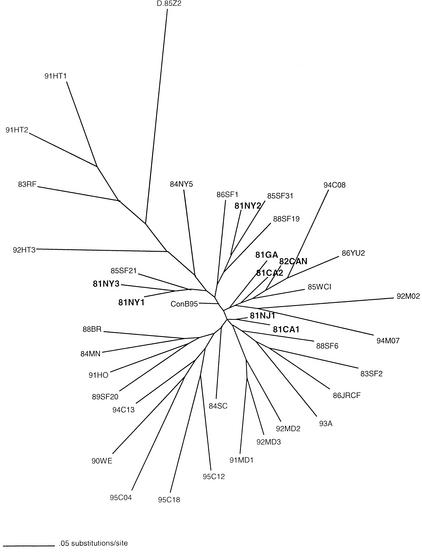
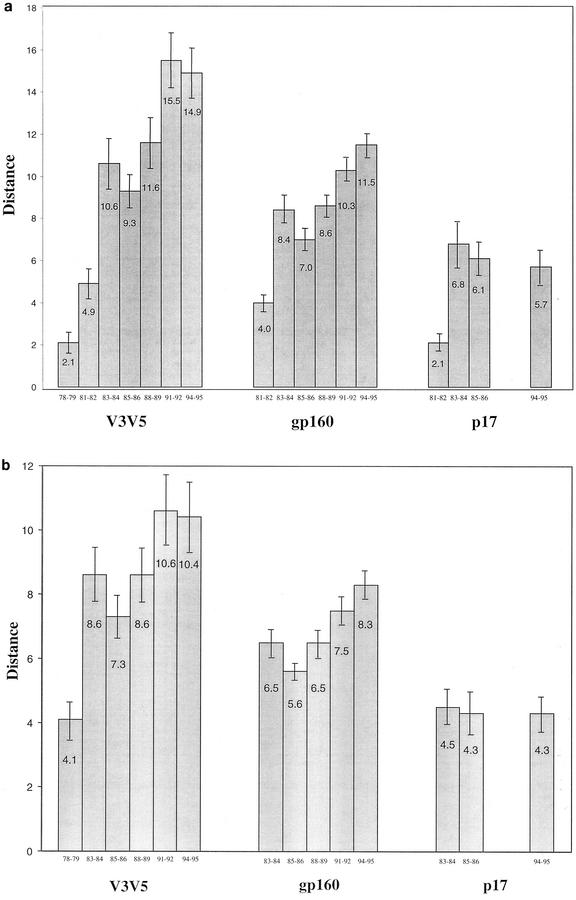
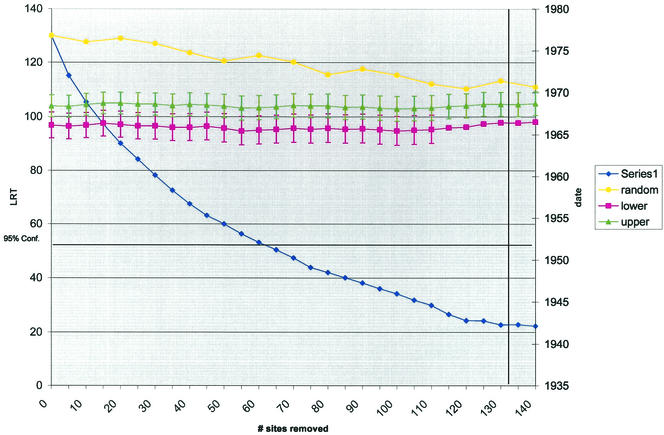
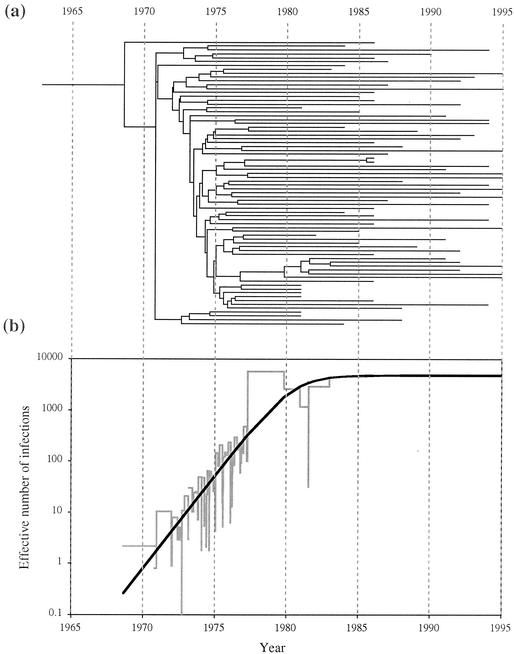
Human immunodeficiency virus (HIV) type 1 subtype B sequences (whole envelope and the p17 region of gag) were obtained from peripheral blood mononuclear cell samples collected in 1981 from seven HIV-infected U.S. individuals and in 1982 from one infected Canadian resident. Phylogenetic and nucleotide distance analyses were performed by using database sequences representing North American strains collected from 1978 to 1995. The estimated phylogeny was starlike, with early strains represented on different lineages. When sequences were grouped by years of collection, nucleotide distance comparisons demonstrated an increase in diversity over time and indicated that contemporary strains are more closely related to early epidemic strains than to each other. Using a recently developed likelihood ratio reduction procedure, the date of origin of the U.S. epidemic was estimated to be 1968 +/- 1.4 years. A coalescent approach was also used to estimate the population history of the U.S. subtype B epidemic. Our analyses provide new information that implies an exponential growth rate from the beginning of the U.S. HIV epidemic. The dating results suggest a U.S. introduction date (or date of divergence from the most recent common ancestor) that precedes the date of the earliest known AIDS cases in the late 1970s. Furthermore, the estimated epidemic growth curve shows a period of exponential growth that preceded most of the early documented cases and also indicates a leveling of prevalence rates in the recent past.
Figures
References
-
- Auerbach, D. M., W. W. Darrow, H. W. Jaffe, and J. W. Curran. 1984. Cluster of cases of the acquired immune deficiency syndrome. Am. J. Med. 76:487-492. - PubMed
-
- Brodin, S. K., J. R. Mascola, P. J. Weiss, S. I. Ito, K. R. Porter, A. W. Artenstein, F. C. Garland, F. E. McCutchan, and D. S. Burke. 1995. Detection of diverse subtypes in the USA. Lancet 346:1198-1199. - PubMed
-
- Centers for Disease Control and Prevention. 1981. Pneumocystis pneumonia—Los Angeles. Morb. Mortal. Wkly. Rep. 30:1-3.
-
- Centers for Disease Control and Prevention. 2001. HIV/AIDS—United States, 1981-2000. Morb. Mortal. Wkly. Rep. 50:430-433. - PubMed
-
- Delwart, E. L., E. G. Shpaer, F. E. McCutchan, J. Louwagie, M. Grez, H. Rubsamen-Waigmann, and J. I. Mullins. 1993. Genetic relationships determined by a heteroduplex mobility assay: analysis of HIV env genes. Science 262:1257-1261. - PubMed
Publication types
MeSH terms
Substances
Associated data
- Actions
- Actions
- Actions
- Actions
- Actions
- Actions
- Actions
- Actions
- Actions
- Actions
- Actions
- Actions
- Actions
- Actions
- Actions
- Actions
LinkOut - more resources
Full Text Sources
Other Literature Sources
Medical
Molecular Biology Databases
Miscellaneous
