

Phylogenetic composition of Arctic Ocean archaeal assemblages and comparison with Antarctic assemblages
- PMID: 14766555
- PMCID: PMC348845
- DOI: 10.1128/AEM.70.2.781-789.2004
Phylogenetic composition of Arctic Ocean archaeal assemblages and comparison with Antarctic assemblages
Abstract
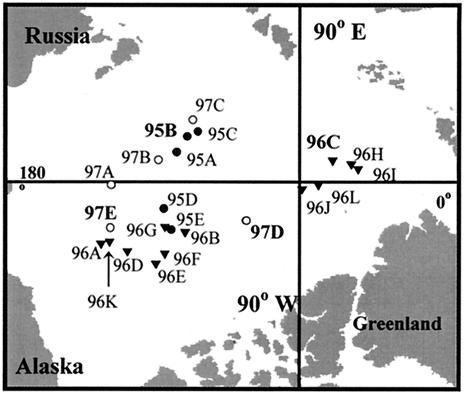
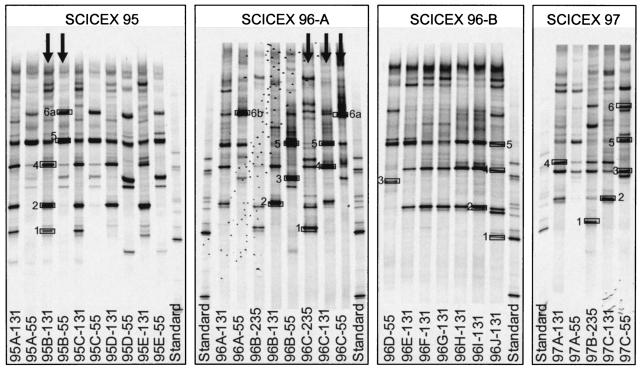
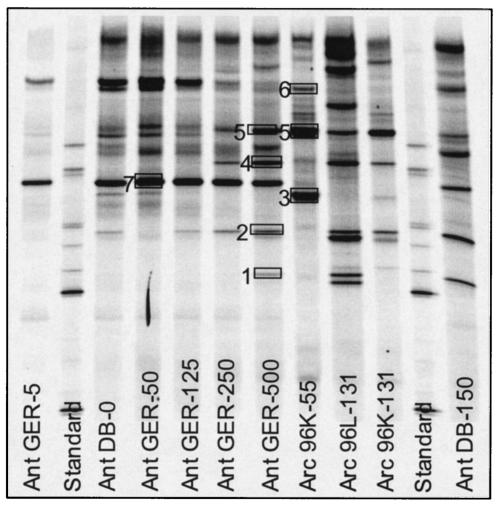
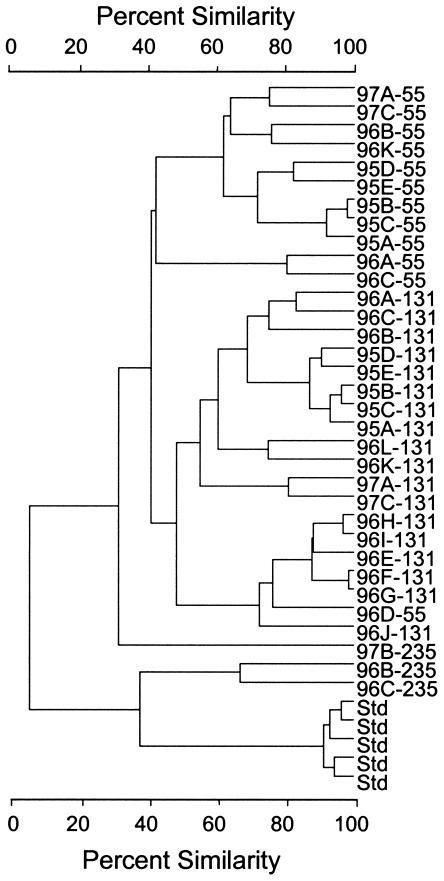
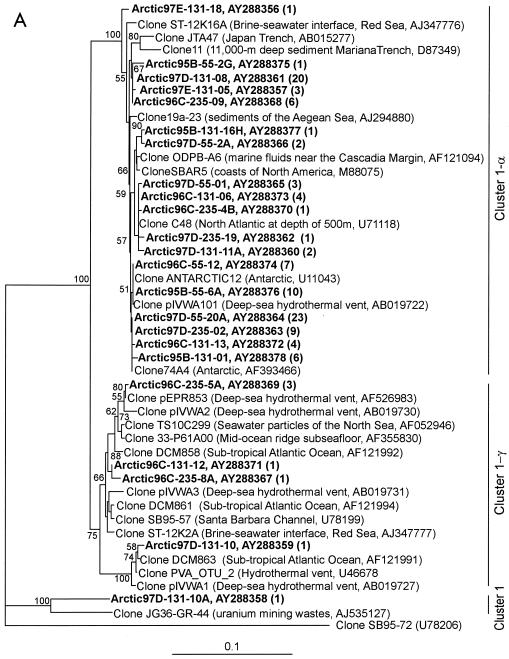
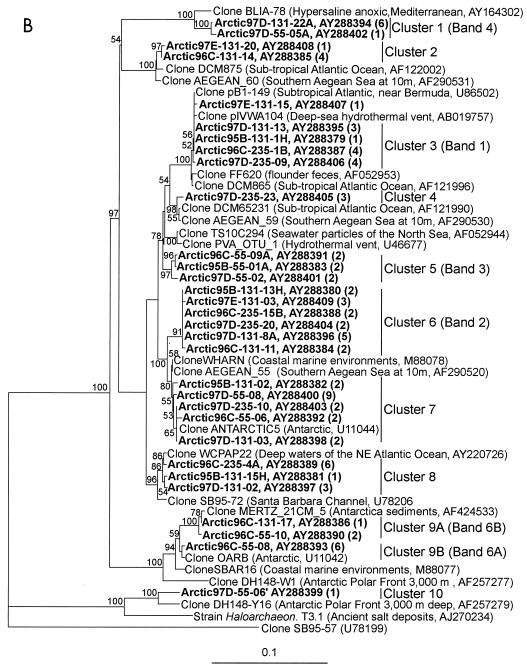
Archaea assemblages from the Arctic Ocean and Antarctic waters were compared by PCR-denaturing gradient gel electrophoresis (DGGE) analysis of 16S rRNA genes amplified using the Archaea-specific primers 344f and 517r. Inspection of the DGGE fingerprints of 33 samples from the Arctic Ocean (from SCICEX submarine cruises in 1995, 1996, and 1997) and 7 Antarctic samples from Gerlache Strait and Dallman Bay revealed that the richness of Archaea assemblages was greater in samples from deep water than in those from the upper water column in both polar oceans. DGGE banding patterns suggested that most of the Archaea ribotypes were common to both the Arctic Ocean and the Antarctic Ocean. However, some of the Euryarchaeota ribotypes were unique to each system. Cluster analysis of DGGE fingerprints revealed no seasonal variation but supported depth-related differences in the composition of the Arctic Ocean Archaea assemblage. The phylogenetic composition of the Archaea assemblage was determined by cloning and then sequencing amplicons obtained from the Archaea-specific primers 21f and 958r. Sequences of 198 clones from nine samples covering three seasons and all depths grouped with marine group I Crenarchaeota (111 clones), marine group II Euryarchaeota (86 clones), and group IV Euryarchaeota (1 clone). A sequence obtained only from a DGGE band was similar to those of the marine group III Euryarchaeota:
Figures
References
-
- Aagaard, K., L. K. Coachman, and E. C. Carmack. 1981. On the halocline of the Arctic Ocean. Deep Sea Res. 28:529-545.
-
- Aagaard, K., J. H. Swift, and E. C. Carmack. 1995. Thermohaline circulation in the Arctic Mediterranean Sea. J. Geophys. Res. 90:4833-4846.
-
- Altschul, S. F., W. Gish, W. Miller, E. W. Myers, and D. J. Lipman. 1990. Basic local alignment search tool. J. Mol. Biol. 215:403-410. - PubMed
Publication types
MeSH terms
Substances
Associated data
- Actions
- Actions
- Actions
- Actions
- Actions
- Actions
- Actions
- Actions
- Actions
- Actions
- Actions
- Actions
- Actions
- Actions
- Actions
- Actions
- Actions
- Actions
- Actions
- Actions
- Actions
- Actions
- Actions
- Actions
- Actions
- Actions
- Actions
- Actions
- Actions
- Actions
- Actions
- Actions
- Actions
- Actions
- Actions
- Actions
- Actions
- Actions
- Actions
- Actions
- Actions
- Actions
- Actions
- Actions
- Actions
- Actions
- Actions
- Actions
- Actions
- Actions
- Actions
LinkOut - more resources
Full Text Sources
Molecular Biology Databases
