

Phylogeny and diversification of the largest avian radiation
- PMID: 15263073
- PMCID: PMC503738
- DOI: 10.1073/pnas.0401892101
Phylogeny and diversification of the largest avian radiation
Abstract
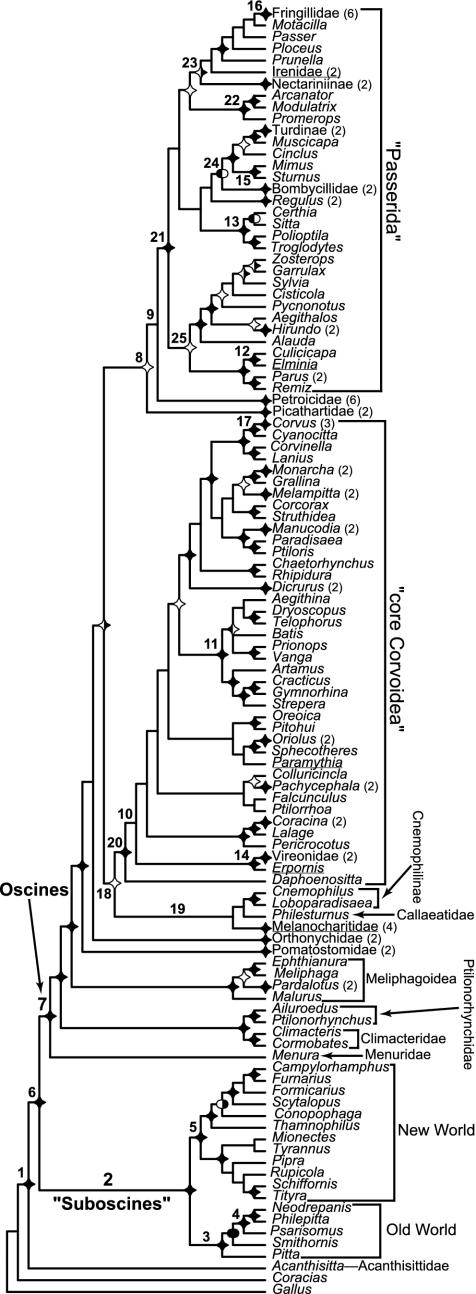
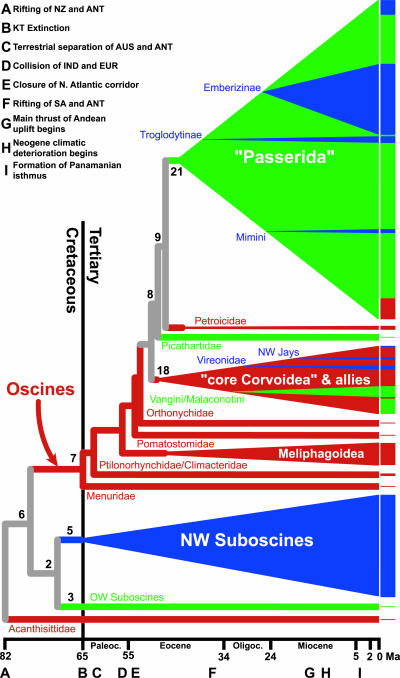
The order Passeriformes ("perching birds") comprises extant species diversity comparable to that of living mammals. For over a decade, a single phylogenetic hypothesis based on DNA-DNA hybridization has provided the primary framework for numerous comparative analyses of passerine ecological and behavioral evolution and for tests of the causal factors accounting for rapid radiations within the group. We report here a strongly supported phylogenetic tree based on two single-copy nuclear gene sequences for the most complete sampling of passerine families to date. This tree is incongruent with that derived from DNA-DNA hybridization, with half of the nodes from the latter in conflict and over a third of the conflicts significant as assessed under maximum likelihood. Our historical framework suggests multiple waves of passerine dispersal from Australasia into Eurasia, Africa, and the New World, commencing as early as the Eocene, essentially reversing the classical scenario of oscine biogeography. The revised history implied by these data will require reassessment of comparative analyses of passerine diversification and adaptation.
Figures
References
-
- Sibley, C. G. & Monroe, B. L., Jr. (1990) Distribution and Taxonomy of the Birds of the World (Yale Univ. Press, New Haven, CT).
-
- Sibley, C. G. & Ahlquist, J. E. (1990) Phylogeny and Classification of Birds: A Study in Molecular Evolution (Yale Univ. Press, New Haven, CT).
-
- Martin, T. E., Martin, P. R., Olson, C. R., Heidinger, B. J. & Fontaine, J. J. (2000) Science 287, 1482–1485. - PubMed
-
- Poiani, A. & Pagel, M. (1997) Evolution (Lawrence, Kans.) 51, 226–240. - PubMed
Publication types
MeSH terms
Associated data
- Actions
- Actions
- Actions
- Actions
- Actions
- Actions
- Actions
- Actions
- Actions
- Actions
- Actions
- Actions
- Actions
- Actions
- Actions
- Actions
- Actions
- Actions
- Actions
- Actions
- Actions
- Actions
- Actions
- Actions
- Actions
- Actions
- Actions
- Actions
- Actions
- Actions
- Actions
- Actions
- Actions
- Actions
- Actions
- Actions
- Actions
- Actions
- Actions
- Actions
- Actions
- Actions
- Actions
- Actions
- Actions
- Actions
- Actions
- Actions
- Actions
- Actions
- Actions
- Actions
- Actions
- Actions
- Actions
- Actions
- Actions
- Actions
- Actions
- Actions
- Actions
- Actions
- Actions
- Actions
- Actions
- Actions
- Actions
- Actions
- Actions
- Actions
- Actions
- Actions
- Actions
- Actions
- Actions
- Actions
- Actions
- Actions
- Actions
- Actions
- Actions
- Actions
- Actions
- Actions
- Actions
- Actions
- Actions
- Actions
- Actions
- Actions
- Actions
- Actions
- Actions
- Actions
- Actions
- Actions
- Actions
- Actions
- Actions
- Actions
- Actions
- Actions
- Actions
- Actions
- Actions
- Actions
- Actions
- Actions
- Actions
- Actions
- Actions
- Actions
- Actions
- Actions
- Actions
- Actions
- Actions
- Actions
- Actions
- Actions
- Actions
- Actions
- Actions
- Actions
- Actions
- Actions
- Actions
- Actions
- Actions
- Actions
- Actions
- Actions
- Actions
- Actions
- Actions
- Actions
- Actions
- Actions
- Actions
- Actions
- Actions
- Actions
- Actions
- Actions
- Actions
- Actions
- Actions
- Actions
- Actions
- Actions
- Actions
- Actions
- Actions
- Actions
- Actions
- Actions
- Actions
- Actions
- Actions
- Actions
- Actions
- Actions
- Actions
- Actions
- Actions
- Actions
- Actions
- Actions
- Actions
- Actions
- Actions
- Actions
- Actions
- Actions
- Actions
- Actions
- Actions
- Actions
- Actions
- Actions
- Actions
- Actions
- Actions
- Actions
- Actions
- Actions
- Actions
- Actions
- Actions
- Actions
- Actions
- Actions
- Actions
- Actions
- Actions
- Actions
- Actions
- Actions
- Actions
- Actions
- Actions
- Actions
- Actions
- Actions
- Actions
- Actions
- Actions
- Actions
- Actions
- Actions
- Actions
- Actions
- Actions
- Actions
- Actions
- Actions
- Actions
- Actions
- Actions
- Actions
- Actions
- Actions
- Actions
- Actions
- Actions
- Actions
LinkOut - more resources
Full Text Sources
