. 2012 May;24(5):1860-75.
doi: 10.1105/tpc.111.093435. Epub 2012 May 25.

Activation of the carbon concentrating mechanism by CO2 deprivation coincides with massive transcriptional restructuring in Chlamydomonas reinhardtii

Affiliations

Activation of the carbon concentrating mechanism by CO2 deprivation coincides with massive transcriptional restructuring in Chlamydomonas reinhardtii

Andrew J Brueggeman et al. Plant Cell. 2012 May.

Erratum in

  • Plant Cell. 2012 Aug;24(8):3483

Abstract

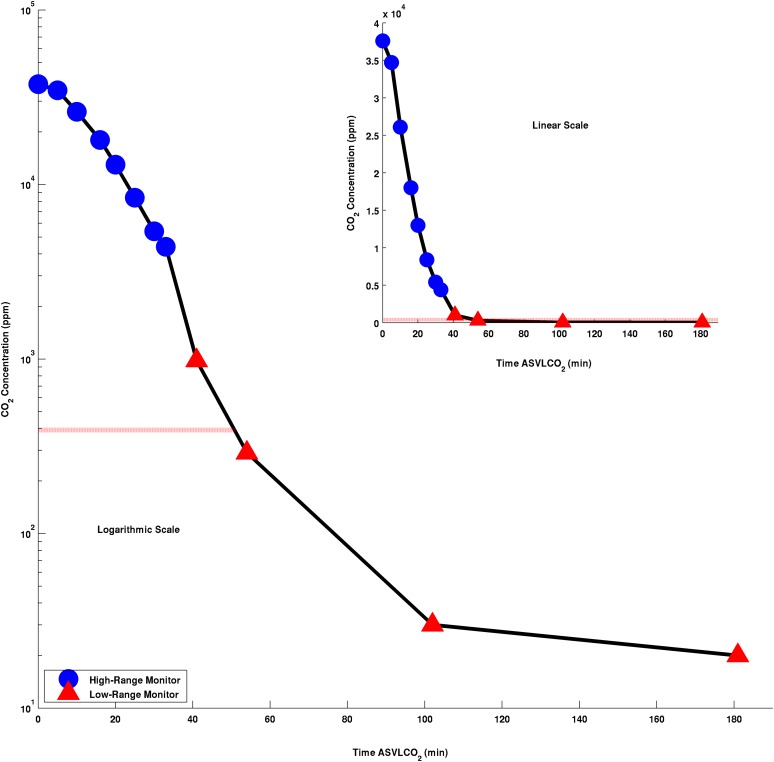
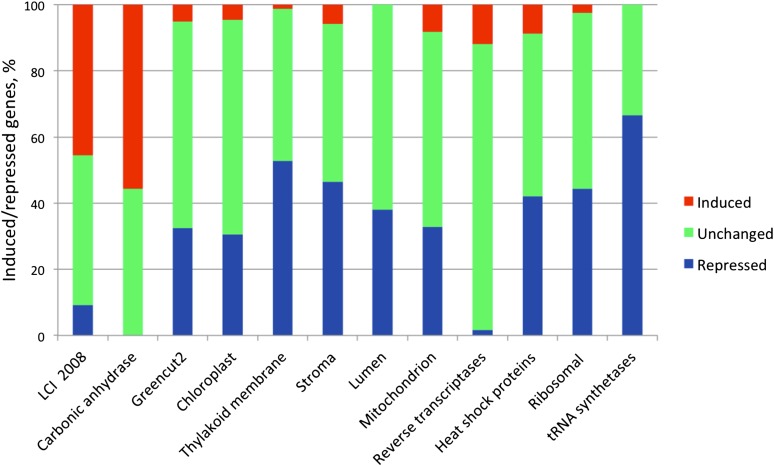
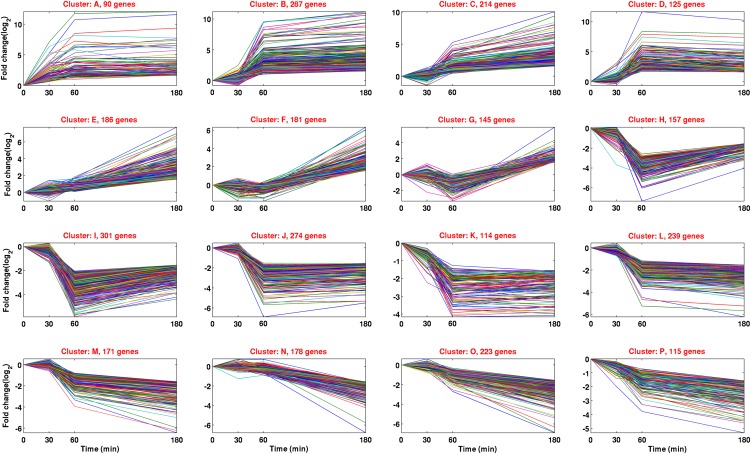
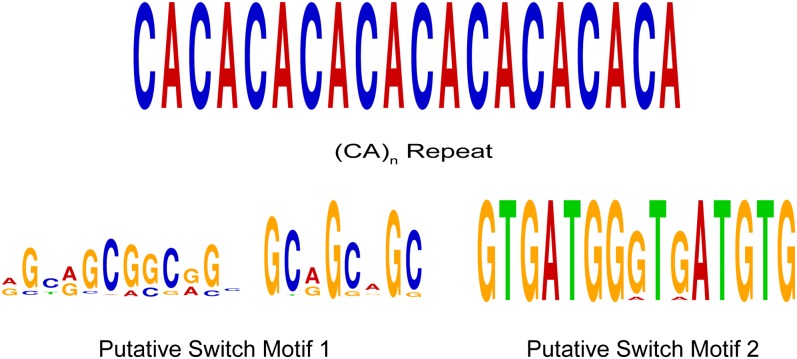
A CO(2)-concentrating mechanism (CCM) is essential for the growth of most eukaryotic algae under ambient (392 ppm) and very low (<100 ppm) CO(2) concentrations. In this study, we used replicated deep mRNA sequencing and regulatory network reconstruction to capture a remarkable scope of changes in gene expression that occurs when Chlamydomonas reinhardtii cells are shifted from high to very low levels of CO(2) (≤100 ppm). CCM induction 30 to 180 min post-CO(2) deprivation coincides with statistically significant changes in the expression of an astonishing 38% (5884) of the 15,501 nonoverlapping C. reinhardtii genes. Of these genes, 1088 genes were induced and 3828 genes were downregulated by a log(2) factor of 2. The latter indicate a global reduction in photosynthesis, protein synthesis, and energy-related biochemical pathways. The magnitude of transcriptional rearrangement and its major patterns are robust as analyzed by three different statistical methods. De novo DNA motif discovery revealed new putative binding sites for Myeloid oncogene family transcription factors potentially involved in activating low CO(2)-induced genes. The (CA)(n) repeat (9 ≤ n ≤ 25) is present in 29% of upregulated genes but almost absent from promoters of downregulated genes. These discoveries open many avenues for new research.


Figures

Figure 1.
Figure 1.
Measurements of CO2 Levels Following a Shift of C. reinhardtii Cells from 5% to 100 ppm CO2. Two CO2 monitors were used in the fermenter: One was calibrated for high CO2 concentrations (squares), and the other was calibrated to low CO2 concentrations (triangles). CO2 concentrations are plotted on a log10 scale. The horizontal red line represents the 392 ppm concentration of the atmosphere.
Figure 2.
Figure 2.
Differential Gene Expression in Major Functional and Subcellular Categories in C. reinhardtii Cells before or after a Shift from High to Low CO2. The percentage of induced genes [red bars; log2(fold change) ≥ 2], repressed genes [blue bars; log2(fold change) ≤ −2] statistically significant at the FDR q ≤ 0.01 level, or unchanged [green bars; log2(fold change) between +2 and −2 and/or not significant]. LCI refers to low CO2–induced genes according to Yamano et al. (2008); greencut2 refers to conserved plant and diatom genes that have no close relatives in other kingdoms and in prokaryotes other than cyanobacteria (Karpowicz et al., 2011).
Figure 3.
Figure 3.
Cluster Analysis of Gene Expression Patterns in C. reinhardtii Cells Subjected to a Change from High to Low CO2 Concentrations. Sixteen clusters were identified by the k-means algorithm. Shown are only the genes that are differentially expressed by a factor of four or more between at least two time points [FDR q ≤ 0.01 and abs(log2[fold change]) ≥ 2]. Time comparisons on the x axis: 0 represents 0-min time point expression levels versus 0 time point expression levels, 30 represents 30-min time point versus 0 time point, 60 represents 60-min time point versus 0 min time point, and 180 represents 180-min time point versus 0 time point. Fold changes in gene expression levels are represented on the y axis in log2 terms.
Figure 4.
Figure 4.
Several HTH Genes Are Coregulated by Bidirectional or Interacting Promoters. Each dot represents a HTH gene pair where the distance between the start codons of the two genes is represented by the horizontal coordinate and the coexpression of the two genes is represented by the vertical coordinate of the dot. Coexpression is measured by the Pearson correlation coefficients between the two HTH genes for the transcript levels at 0, 30, 60, and 180 min after carbon deprivation.
Figure 5.
Figure 5.
Putative Transcription Factor Binding Sites and Switch Motifs. Putative switch motifs were found in intergenic regions between HTH gene pairs with negatively correlated transcription. Motifs are shown as sequence logos where the horizontal axis indicates sequence position and the vertical axis shows information content, related to conservation.

References

    1. Anders S., Huber W. (2010). Differential expression analysis for sequence count data. Genome Biol. 11: R106. - PMC - PubMed
    1. Ashburner M., et al. The Gene Ontology Consortium (2000). Gene ontology: Tool for the unification of biology. Nat. Genet. 25: 25–29 - PMC - PubMed
    1. Bailey T.L., Boden M., Buske F.A., Frith M., Grant C.E., Clementi L., Ren J., Li W.W., Noble W.S. (2009). MEME SUITE: Tools for motif discovery and searching. Nucleic Acids Res. 37(Web Server issue): W202–W208 - PMC - PubMed
    1. Benjamini Y., Hochberg Y. (1995). Controlling the false discovery rate: a practical and powerful approach to multiple hypothesis testing. J. R. Statist. Soc. B 57: 289–300
    1. Casas-Mollano J.A., Rohr J., Kim E.J., Balassa E., van Dijk K., Cerutti H. (2008). Diversification of the core RNA interference machinery in Chlamydomonas reinhardtii and the role of DCL1 in transposon silencing. Genetics 179: 69–81 - PMC - PubMed

Publication types

MeSH terms

Associated data

LinkOut - more resources