Comparative Study
. 2009 Nov;21(11):3436-49.
doi: 10.1105/tpc.109.068825. Epub 2009 Nov 30.

Clocks in the green lineage: comparative functional analysis of the circadian architecture of the picoeukaryote ostreococcus

Affiliations
Comparative Study

Clocks in the green lineage: comparative functional analysis of the circadian architecture of the picoeukaryote ostreococcus

Florence Corellou et al. Plant Cell. 2009 Nov.

Abstract

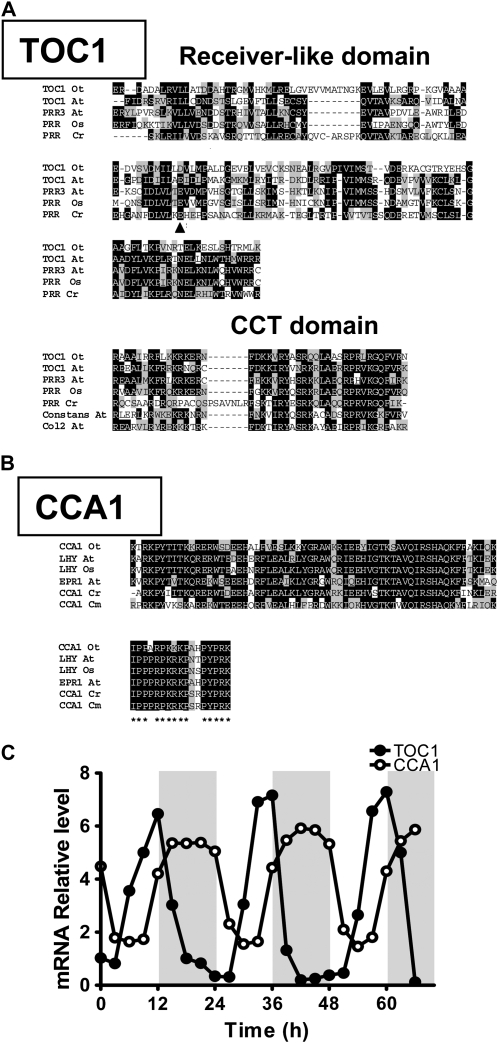
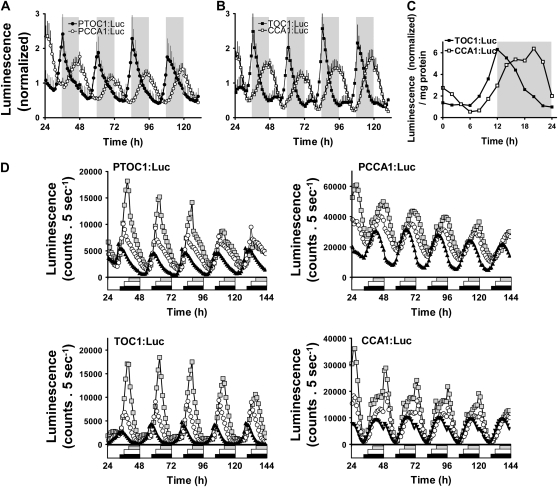
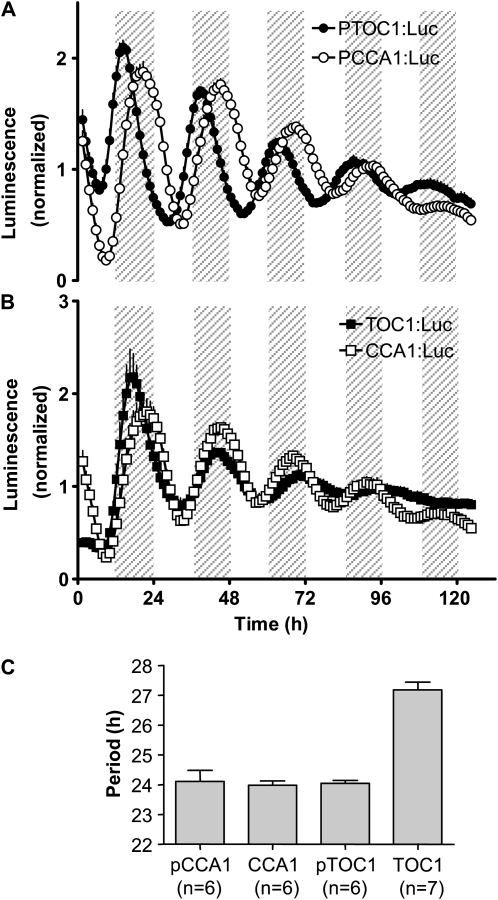
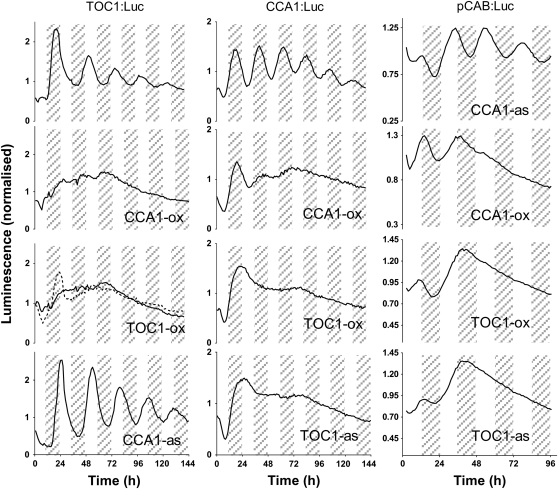
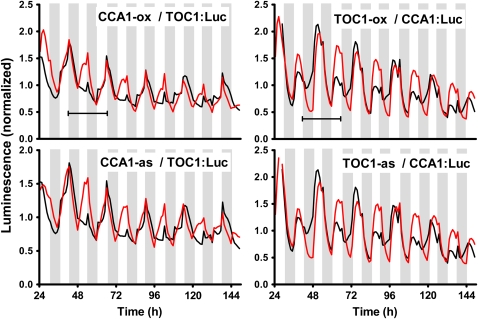
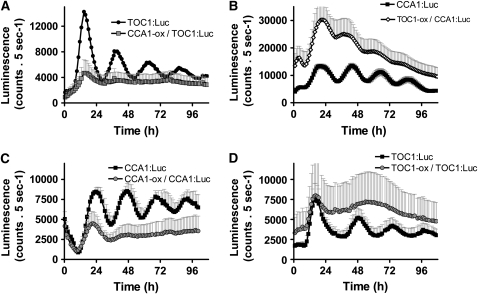
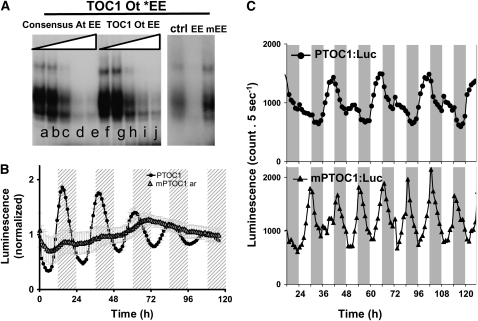
Biological rhythms that allow organisms to adapt to the solar cycle are generated by endogenous circadian clocks. In higher plants, many clock components have been identified and cellular rhythmicity is thought to be driven by a complex transcriptional feedback circuitry. In the small genome of the green unicellular alga Ostreococcus tauri, two of the master clock genes Timing of Cab expression1 (TOC1) and Circadian Clock-Associated1 (CCA1) appear to be conserved, but others like Gigantea or Early-Flowering4 are lacking. Stably transformed luciferase reporter lines and tools for gene functional analysis were therefore developed to characterize clock gene function in this simple eukaryotic system. This approach revealed several features that are comparable to those in higher plants, including the circadian regulation of TOC1, CCA1, and the output gene Chlorophyll a/b Binding under constant light, the relative phases of TOC1/CCA1 expression under light/dark cycles, arrhythmic overexpression phenotypes under constant light, the binding of CCA1 to a conserved evening element in the TOC1 promoter, as well as the requirement of the evening element for circadian regulation of TOC1 promoter activity. Functional analysis supports TOC1 playing a central role in the clock, but repression of CCA1 had no effect on clock function in constant light, arguing against a simple TOC1 /CCA1 one-loop clock in Ostreococcus. The emergence of functional genomics in a simple green cell with a small genome may facilitate increased understanding of how complex cellular processes such as the circadian clock have evolved in plants.


Figures

Figure 1.
Figure 1.
In Silico Identification and Expression Patterns of TOC1 and CCA1 Genes. (A) and (B) ClustalW alignment of receiver and CCT domains in TOC1 proteins, PRRs, and CONSTANS-like proteins (A) and of MYB domains in the CCA1/LHY REVEILLE family (B). The arrowhead indicates the position of a conserved aspartyl residue (phosphate receiver) that is mutated to glutamyl in all PRRs except Ostreococcus TOC1. Asterisks indicate amino acid residues specific to the REVEILLE family. Ot, O. tauri; At, A. thaliana; Cm, C. merolae; Cr, C. reinhardtii; Os, O. sativa. Accession numbers are given in Methods. (C) Microarray analysis of TOC1 (closed circles) and CCA1 (open circles) mRNA patterns under LD: 12,12 entraining cycles. Gray areas represent nights.
Figure 2.
Figure 2.
Regulation of TOC1 and CCA1 Promoter Activities and Protein Synthesis under 24-h LD Cycles of Different Photoperiods. Dark periods are represented by gray areas ([A] to [C]) or scaled on the x axis (D). Bioluminescence of lines carrying TOC1 and CCA1 transcriptional (promoter fused to the luciferase) or translational (full gene fused to luciferase) fusions. (A) and (B) LD: 12,12 entraining cycles. Means of transcriptional fusions (A) (PTOC1:Luc, closed circles, n = 5; PCCA1:Luc, open circles, n = 6) and of translational fusions (B) (TOC1:Luc, closed squares, n = 4; CCA1:Luc, open squares, n = 6). Error bars represent se. (C) In vitro luciferase assay on protein extracts from individual TOC1:Luc (closed squares) and CCA1:luc (open squares) translational fusion lines, representative of three trials. (D) Phase and amplitude adjustments of TOC1 and CCA1 promoter activity and protein synthesis to photoperiod. Transcriptional and translational reporter lines were entrained under LD: 8,16 (gray squares), LD: 12,12 (white circles), and LD: 16,8 (black triangles) for 8 d and transferred at the same cell density for recording under identical conditions. Means of triplicates of representative transcriptional and translational fusion are shown, and the se is smaller than symbols.
Figure 3.
Figure 3.
Regulation of TOC1 and CCA1 Promoter Activity and Protein Synthesis upon Release from LD: 12,12 into LL. Subjective night is represented by gray areas. (A) and (B) Bioluminescence of lines carrying TOC1 and CCA1 transcriptional (promoter fused to the luciferase) or translational (full gene fused to luciferase) fusions. (A) Transcriptional fusions in LL (PTOC1:Luc, n = 3; PCCA1:Luc, n = 3). (B) Translational fusions in LL (TOC1:Luc n = 3; CCA1:Luc n = 3). Means ± se are represented. (C) Period length of the different reporter lines in LL. Periods were analyzed from 24 h after release into constant light. Means ± sd are shown. n indicates the number of individual reporter lines (plated in duplicate) for monitoring promoter activity or protein synthesis.
Figure 4.
Figure 4.
Functional Analysis of TOC1 and CCA1 under Free-Running Conditions (LL). Representative bioluminescence traces of TOC1:Luc, CCA1:Luc, and PCAB:Luc in different backgrounds or the wild type (unlabeled graphs). Data sets are representative of at least of three trials. Subjective night is represented by gray areas. Overexpression of CCA1 (CCA1-ox) altered the rhythmicity of TOC1:Luc (number of arrhythmic lines [ar] = 3; number of lines with dampened rhythmicity [dr] = 10; n = 23), CCA1:Luc (ar = 1, dr = 5; n = 22), and PCAB:Luc, but CCA1-antisense (CCA1-as) had no effect on either TOC1:Luc (ar = 0, dr = 0; n = 17) or PCAB:Luc rhythmicity (ar = 0, dr = 0; n = 30). Overexpression of TOC1 (TOC1-ox) altered the rhythmicity of TOC1:Luc (ar = 4, dr = 3; n = 13), CCA1:Luc (ar = 17, dr = 12; n = 42), and PCAB:Luc (ar = 15; n = 31). Downregulation of TOC1 (TOC1-as) had a similar effect on CCA1:Luc (ar = 2, dr = 7; n = 21) and PCAB:Luc rhythmicity (ar = 16; n = 31). Note that the strongest phenotypes are represented.
Figure 5.
Figure 5.
CCA1 Downregulation Disrupts Circadian Entrainment of TOC1:Luc Expression under LD: 6,6. Bioluminescence traces of representative CCA1- and TOC1-ox and -as lines in the TOC1:Luc and CCA1:Luc backgrounds are shown. Lines grown under constant light were transferred at the same cell density to LD: 6,6. Time zero corresponds to the beginning of the first period of light. TOC1:Luc and CCA1:Luc control lines are represented in black, and ox and as lines are in red. TOC1:Luc and CCA1:Luc display a biphasic 24-h pattern of oscillation (underlined). By contrast, ox/as lines respond directly to each LD: 6,6 cycle. Note that repressing CCA1 in TOC1:Luc (CCA1-as/TOC1:Luc) leads to a loss of the 24-h module in lines found to be rhythmic in LL. Data sets are representative of three trials.
Figure 6.
Figure 6.
Quantitative Effect of TOC1 and CCA1 Overexpression on TOC1:Luc and CCA1:Luc Levels. Lines with altered rhythmic phenotypes were monitored under constant light. Means ± se are plotted. Control lines are shown in each panel (n = 3 to 4). (A) CCA1-ox/TOC1:Luc lines (n = 13). (B) TOC1-ox/CCA1:Luc lines (n = 19). (C) CCA1-ox/CCA1:Luc lines (n = 6). (D) TOC1-ox/TOC1:Luc lines (n = 7).
Figure 7.
Figure 7.
Functional Analysis of the Consensus EE of the Ostreococcus TOC1 Promoter. (A) Gel mobility electrophoretic assay of CCA1 using the EE sequence of the TOC1 promoter as the labeled probe. Competition experiments reveal that the recombinant CCA1 specifically binds to the EE (AAAATATCT) in the 100-bp upstream region of the 250-bp TOC1 promoter. In the left panel, the labeled EE probe of Ostreococcus was incubated with 10 ng of recombinant CCA1 protein. No competitor DNA was added in lanes a and f. The unlabeled competitor DNA corresponded to the Arabidopsis consensus sequence (lanes b through e) or the EE motif in the context of the Ostreococcus promoter (lanes g through j). White triangles represent increasing amount of competitor, which was present at 5-, 25-, 50-, and 100-fold molar excess to the labeled probe (lanes b to e and g to j). Right panel: No DNA (crtl), the Ostreococcus EE, or the mutated mEE (AAAAgcTtT) was added as the unlabeled competitor to the labeled EE incubated with 10 ng of recombinant CCA1 protein. No competition for CCA1 binding was observed at a 100-fold excess of mEE. (B) Analysis of the activity of the TOC1 promoter with mutations in the EE. Transcriptional TOC1:Luc lines with the mutated EE (mPTOC1:Luc) were generated and analyzed under LL after LD: 12,12 entrainment. Subjective night is represented by hashed gray areas. mPTOC1:Luc lines (n = 28) were either arrhythmic in LL (ar, gray triangle, n = 18) or displayed dampened rhythmicity (n = 10, data not shown) compared with control lines (PTOC1:Luc). Means ± se are shown. (C) Analysis of mPTOC1:Luc reporter lines under LD: 6,6 cycles. Representative traces are shown. Top panel: Bioluminescence of control PTOC1:Luc reporter lines. Bottom panel: Bioluminescence of mPTOC1:Luc lines.

Comment in

References

    1. Alabadi, D., Oyama, T., Yanovsky, M.J., Harmon, F.G., Mas, P., and Kay, S.A. (2001). Reciprocal regulation between TOC1 and LHY/CCA1 within the Arabidopsis circadian clock. Science 293 880–883. - PubMed
    1. Alabadi, D., Yanovsky, M.J., Mas, P., Harmer, S.L., and Kay, S.A. (2002). Critical role for CCA1 and LHY in maintaining circadian rhythmicity in Arabidopsis. Curr. Biol. 12 757–761. - PubMed
    1. Carre, I.A., and Kim, J.Y. (2002). MYB transcription factors in the Arabidopsis circadian clock. J. Exp. Bot. 53 1551–1557. - PubMed
    1. Cerutti, H., Johnson, A.M., Gillham, N.W., and Boynton, J.E. (1997). Epigenetic silencing of a foreign gene in nuclear transformants of Chlamydomonas. Plant Cell 9 925–945. - PMC - PubMed
    1. Courties, C., Vaquer, A., Troussellier, M., Lautier, J., Chrétiennot-Dinet, M.J., Neveux, J., Machado, C., and Claustre, H. (1994). Smallest eukaryotic organism. Nature 370 255.

Publication types

MeSH terms