. 2005 Jul;15(7):987-97.
doi: 10.1101/gr.3455305.

Examples of the complex architecture of the human transcriptome revealed by RACE and high-density tiling arrays

Affiliations

Examples of the complex architecture of the human transcriptome revealed by RACE and high-density tiling arrays

Philipp Kapranov et al. Genome Res. 2005 Jul.

Abstract

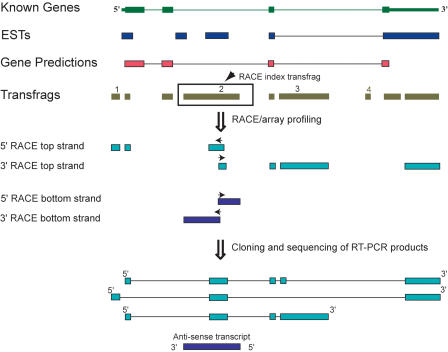
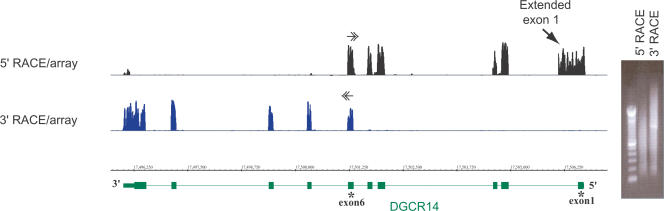
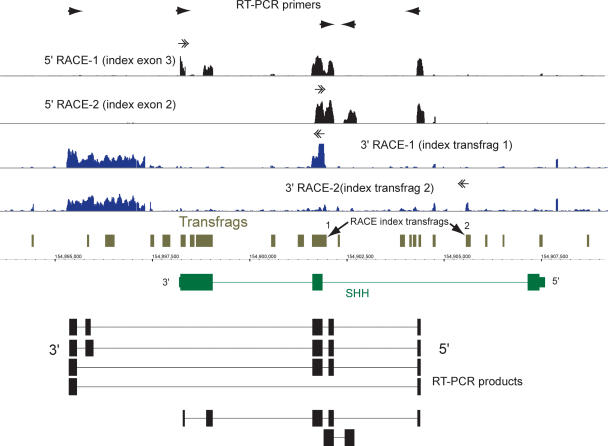
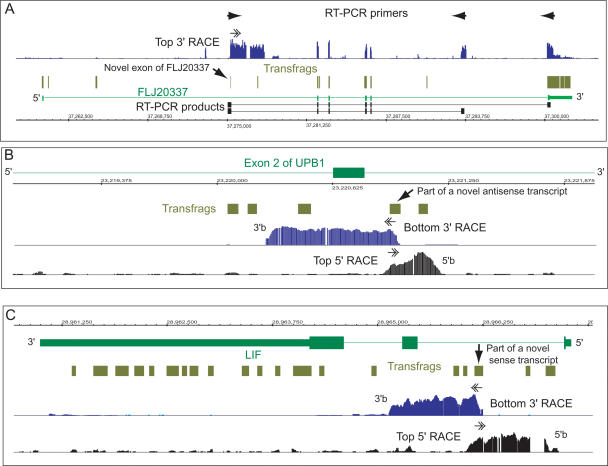
Recently, we mapped the sites of transcription across approximately 30% of the human genome and elucidated the structures of several hundred novel transcripts. In this report, we describe a novel combination of techniques including the rapid amplification of cDNA ends (RACE) and tiling array technologies that was used to further characterize transcripts in the human transcriptome. This technical approach allows for several important pieces of information to be gathered about each array-detected transcribed region, including strand of origin, start and termination positions, and the exonic structures of spliced and unspliced coding and noncoding RNAs. In this report, the structures of transcripts from 14 transcribed loci, representing both known genes and unannotated transcripts taken from the several hundred randomly selected unannotated transcripts described in our previous work are represented as examples of the complex organization of the human transcriptome. As a consequence of this complexity, it is not unusual that a single base pair can be part of an intricate network of multiple isoforms of overlapping sense and antisense transcripts, the majority of which are unannotated. Some of these transcripts follow the canonical splicing rules, whereas others combine the exons of different genes or represent other types of noncanonical transcripts. These results have important implications concerning the correlation of genotypes to phenotypes, the regulation of complex interlaced transcriptional patterns, and the definition of a gene.


Figures

Figure 1.
Figure 1.
A schematic representation of the transcriptome data and RACE/array workflow. An example of a locus defined by bounds of a known gene is shown together with additional existing genome annotations, such as ESTs and GenScan predictions. Exons are represented by boxes and introns by lines. Throughout all of the figures, transcriptome data derived from array profiling of cellular RNA are represented by transcribed fragments (transfrags; olive green).
Figure 2.
Figure 2.
RACE/array profiling of the DGCR14 gene, located on the bottom strand of Chromosome 22. 5′- and 3′-RACE profiling with RACE primers selected at exon-exon junctions of exons 6/7 and 5/6, correspondingly. In this and the following figures, positions and directions (5′-3′) of the RACE primers are indicated by horizontal double arrows, and annotations are represented by UCSC Known Genes or RefSeqs (http://www.genome.ucsc.edu) (green). In addition, RACE/array data are always represented as graphs of signal intensities for every probe on an array. The gel image of electrophoretic profiles of the RACE reactions prior to array-hybridizations are also shown. Profiles of known exons (bottom) can be clearly discerned from the RACE/array maps.
Figure 3.
Figure 3.
Several novel exons can be found in the gene SHH, which encodes a human homolog of Sonic hedgehog. The 5′-RACE/array profiling was performed with primers designed in exons 2 and 3 of the annotated form. The 3′-RACE/array profiling was performed with primers positioned in two unannotated transfrags in intron 1 (indicated by the arrows). A significant amount of signal can be seen in intron 1 of the gene, representing alternative exons of this gene. The annotated form of exon 3 appears to be represented as two different exons. An alternative 3′-exon was detected downstream of the annotated gene bounds. The maps of cloned RT-PCR products representing different alternative isoforms of transcripts containing novel exons are shown at the bottom.
Figure 4.
Figure 4.
Different classes of novel intronic transfrags revealed by RACE/array. (A) A novel transfrag (shown by an arrow) within RIKEN cDNA FLJ20337 (top strand, Chromosome 6) represents a novel exon of this gene, as evidenced by the 3′-RACE/array profile and sequences of two different RT-PCR products. (B) Several novel intronic transfrags represent a bottom-strand transcript antisense to the UPB1 gene (top strand, Chromosome 22), as evidenced by 5′- and 3′-RACE/array analyses. (C) Intronic transfrags within the LIF gene (bottom strand, Chromosome 22) represent internal sense transcripts as evidenced by 5′- and 3′-RACE/array analysis. Approximate positions of the 5′- and 3′-ends of the transcripts on the bottom strand in panels B and C are indicated as “5′b” and “3′b.”
Figure 5.
Figure 5.
Overlapping sense transcripts in the HLXB9 locus. RACE/array analysis of two non-exonic transfrags (transfrags 1 and 2, depicted by arrows) of the HLXB9 gene, encoding a homeobox protein, is shown. Both 5′- and 3′-RACE/array profiles are shown for each of the two transfrags as 5′/3′-RACE-1 and 5′/3′-RACE-2, correspondingly. Both transfrags are connected together in a novel sense transcript located within intron 1 of HLXB9 on the bottom strand of Chromosome 7. Transfrag 2, however, is also represented as an alternative exon in several novel HXLB9 transcripts. This transfrag is also connected to a distant downstream region located ∼16 kb away. The maps of cloned RT-PCR products representing different alternative isoforms of transcripts containing novel exons are shown at the bottom.
Figure 6.
Figure 6.
Overlapping sense/antisense transcripts in the PISD locus. RACE/array profiling of five novel transfrags found within an isoform of the PISD gene (accession no. BC001482), encoding phosphatidylserine decarboxylase, reveals a complex pattern of sense/antisense transcription. For each index transfrag (panels 1-5 and indicated by arrows), the presence of a transcript on either the bottom-sense strand or top-antisense strand, with respect to PISD, was interrogated using two 5′-RACE/array and two 3′-RACE/array assays with RACE primers designed to query for transcription on either strand. The position of the index transfrag is also indicated by the opaque vertical lines in the corresponding group of four RACE maps (5′/3′-RACE on the top and 5′/3′-RACE on the bottom strand). Approximate positions of the 5′- and 3′-ends of the transcripts on the top or bottom strand are indicated as “5′t,” “3′t,” “5′b,” and “3′b.” ChIP-CHIP profiles with anti-cMyc anti-body compared to input control DNA are also shown (Cawley et al. 2004). Two prominent sites at both 5′- and 3′-ends of the PISD gene, together with sites of lower affinity, can be seen.
Figure 7.
Figure 7.
RACE/array transcript profiling in a novel locus on Chromosome 6, Chr6-74. The position of the index transfrag for RACE/array profiling is shown by an arrow on the track of the array-detected transfrags in this region. The presence of a transcript on either the top or bottom strand was interrogated using two 5′-RACE/array and two 3′-RACE/array assays with RACE primers designed to query for transcription on either strand. For the gene on the top strand, two 5′-RACE primers, separated by 428 bp, were used and are represented by 5′-RACE-1 and 5′-RACE-2 tracks. Transfrags not connected by RACE/array indicate the presence of additional transcripts in this locus.

References

    1. Bijlsma, M.F., Spek, C.A., and Peppelenbosch, M.P. 2004. Hedgehog: An unusual signal transducer. Bioessays 26: 387-394. - PubMed
    1. Cawley, S., Bekiranov, S., Ng, H.H., Kapranov, P., Sekinger, E.A., Kampa, D., Piccolboni, A., Sementchenko, V., Cheng, J., Williams, A.J., et al. 2004. Unbiased mapping of transcription factor binding sites along human chromosomes 21 and 22 points to widespread regulation of noncoding RNAs. Cell 116: 499-509. - PubMed
    1. Chen, J., Sun, M., Lee, S., Zhou, G., Rowley, J.D., and Wang, S.M. 2002. Identifying novel transcripts and novel genes in the human genome by using novel SAGE tags. Proc. Natl. Acad. Sci. 99: 12257-12262. - PMC - PubMed
    1. Cheng, J., Kapranov, P., Drenkow, J., Dike, S., Brubaker, S., Patel, S., Long, J., Stern, D., Tammana, H., Helt, G., et al. 2005. Transcriptional maps of 10 human chromosomes at 5-nucleotide resolution. Science http://www.sciencemag.org/cgi/content/abstract/1108625v2. - PubMed
    1. Hawkins, P.R., Jin, P., and Fu, G.K. 2003. Full-length cDNA synthesis for long-distance RT-PCR of large mRNA transcripts. Biotechniques 34: 768-770, 772-773. - PubMed

Web site references

    1. http://transcriptome.affymetrix.com/publication/race/; RACE/array data of this paper.
    1. http://www.affymetrix.com/support/developer/downloads/TilingArrayTools/i...; Integrated Genome Browser.
    1. http://www.genome.ucsc.edu; UCSC Genome Browser.

Publication types

Substances

Associated data