. 2006 Dec;18(12):3548-63.
doi: 10.1105/tpc.106.042028. Epub 2006 Dec 22.

The plant-specific ssDNA binding protein OSB1 is involved in the stoichiometric transmission of mitochondrial DNA in Arabidopsis

Affiliations

The plant-specific ssDNA binding protein OSB1 is involved in the stoichiometric transmission of mitochondrial DNA in Arabidopsis

Vincent Zaegel et al. Plant Cell. 2006 Dec.

Abstract

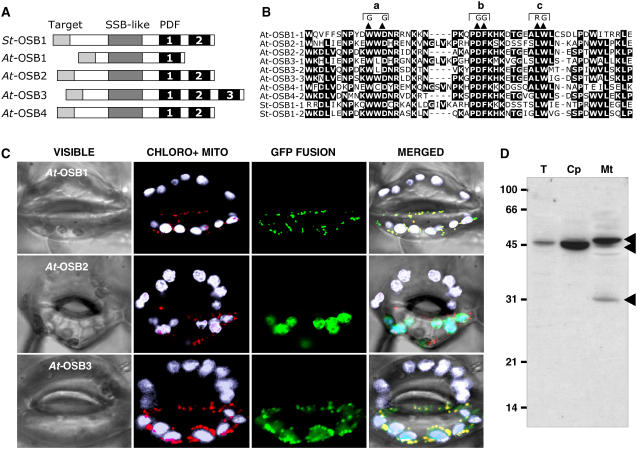
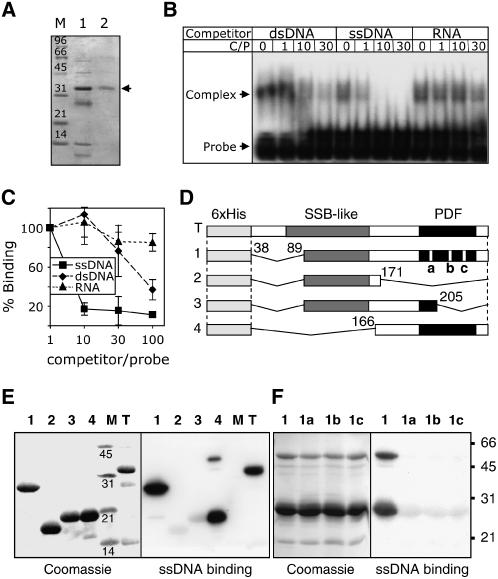
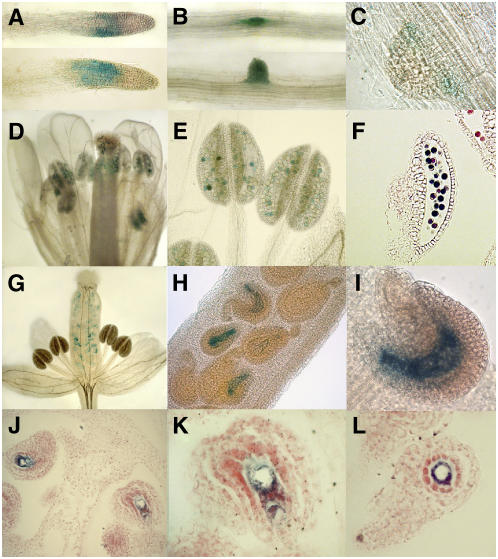
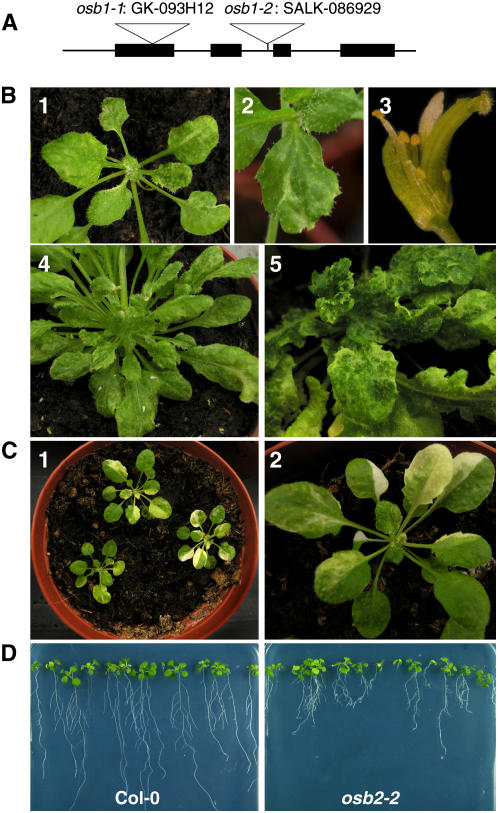
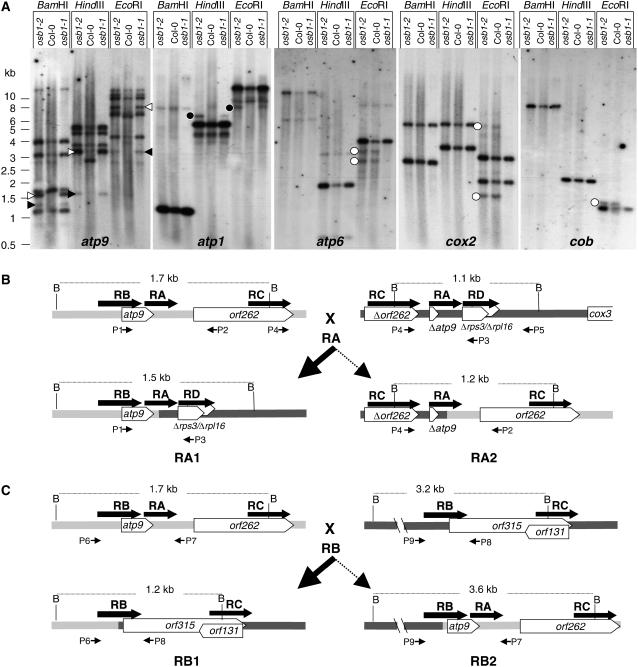
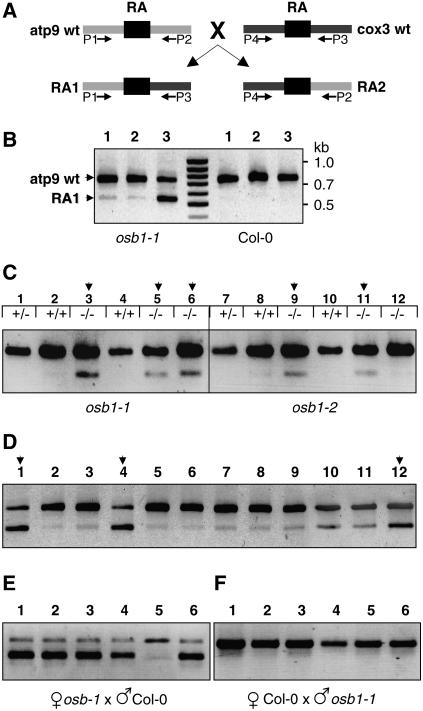
Plant mitochondrial genomes exist in a natural state of heteroplasmy, in which substoichiometric levels of alternative mitochondrial DNA (mtDNA) molecules coexist with the main genome. These subgenomes either replicate autonomously or are created by infrequent recombination events. We found that Arabidopsis thaliana OSB1 (for Organellar Single-stranded DNA Binding protein1) is required for correct stoichiometric mtDNA transmission. OSB1 is part of a family of plant-specific DNA binding proteins that are characterized by a novel motif that is required for single-stranded DNA binding. The OSB1 protein is targeted to mitochondria, and promoter-beta-glucuronidase fusion showed that the gene is expressed in budding lateral roots, mature pollen, and the embryo sac of unfertilized ovules. OSB1 T-DNA insertion mutants accumulate mtDNA homologous recombination products and develop phenotypes of leaf variegation and distortion. The mtDNA rearrangements occur in two steps: first, homozygous mutants accumulate subgenomic levels of homologous recombination products; second, in subsequent generations, one of the recombination products becomes predominant. After the second step, the process is no longer reversible by backcrossing. Thus, OSB1 participates in controlling the stoichiometry of alternative mtDNA forms generated by recombination. This regulation could take place in gametophytic tissues to ensure the transmission of a functional mitochondrial genome.


Figures

Figure 1.
Figure 1.
Purification of the Potato Mitochondrial OSB1 Protein. (A) Soluble proteins (8 μg) from potato mitochondria were fractionated by SDS-PAGE, transferred to polyvinylidene difluoride membranes, and probed for DNA binding. Lane 1, Ponceau S staining of the proteins; lane 2, protein/DNA gel blot of proteins probed with a 5′ end-labeled random 37-nucleotide single-strand oligonucleotide. (B) Purification of the 40-kD protein by ssDNA chromatography. Coomassie blue staining of the proteins eluted at 0.3, 0.6, and 2.0 M NaCl. The proteins eluting at 2.0 M were separated (right lane), and the 40-kD protein (arrowhead) was extracted and sequenced.
Figure 2.
Figure 2.
Characterization of the OSB Protein Family. (A) Basic structure of OSB proteins from potato (St OSB1) and Arabidopsis (At OSB1 to OSB4). The PDF motifs are numbered. (B) Alignment of PDF motifs of the proteins. The double substitution mutations (a, b, and c) analyzed in Figure 3 are indicated. (C) Localization of protein-eGFP fusions in guard cells of N. benthamiana. Green, eGFP fluorescence; white, natural fluorescence of chloroplasts; red, fluorescence of the mitochondrial marker. (D) Protein gel blot of protein fractions probed with antibodies raised against OSB1: total fraction (T)–, chloroplast (Cp)-, and mitochondria (Mt)- enriched fractions. Protein fractions were extracted from Arabidopsis cells in suspension culture as described (Laloi et al., 2001).
Figure 3.
Figure 3.
ssDNA Binding Activity of At OSB1. (A) Nickel-nitrilotriacetic acid agarose affinity chromatography purification of soluble At OSB1 expressed in E. coli. Lane 1, proteins eluting with 50 mM imidazole; lane 2, purified protein eluting with 150 mM imidazole. (B) Electrophoretic mobility shift assay of nucleic acid binding. At OSB1 and 32P-labeled ssDNA probe were incubated with increasing quantities of cold competitor before electrophoresis. dsDNA, ssDNA, and RNA competitors were of the same size and sequence as the probe. The molar ratio of competitor to probe (C/P) is given. At OSB1/ssDNA complexes are shown by arrowheads. (C) At OSB1 purified under denaturing conditions was tested on protein/DNA gel blots for binding to labeled ssDNA in the presence of increasing concentrations of cold competitor (ssDNA, dsDNA, or RNA). Results were quantified using a phosphor imager. Error bars indicate the sd of three independent experiments. (D) Structure of At OSB1 mutants expressed in E. coli. SSB-like, PDF, and deleted regions are indicated. a, b, and c refer to the double substitution mutations described for Figure 2B. (E) Analysis of ssDNA binding by At OSB1 mutant proteins. Expressed proteins described for (D) were fractionated by SDS-PAGE, transferred to polyvinylidene difluoride membranes, and probed with labeled ssDNA. (F) Same as (E) using construct 1 with mutation a, b, or c.
Figure 4.
Figure 4.
Histochemical Localization of GUS Activity in Arabidopsis Plants Transformed with the Intergenic Region Upstream At OSB1 Gene Fused to the GUS Reporter Gene. (A) to (C) Roots in an 18-d-old plantlet. (D) to (F) Expression is detected in pollen grains of mature flowers. Expression in unfertilized ovules is visible in immature flowers. (G) Whole flower. (H) and (I) Closer views. (J) to (L) Sections of unfertilized ovules showing that expression is restricted to the embryo sac.
Figure 5.
Figure 5.
Variegated and Distorted Phenotypes of At OSB1 T-DNA Insertion Mutants. (A) Physical map of the At OSB1 gene. The positions of the T-DNA insertions in osb1-1 and osb1-2 mutants are indicated. (B) Examples of variegation and distortion phenotypes in leaves and flowers of osb1-1 (panels 1, 2, and 4) and osb1-2 (panels 3 and 5) mutants. (C) Examples of variegation in leaves of an msh1 T-DNA insertion mutant. (D) Comparison of the roots from Col-0 and osb2-2 plants at 21 d after germination on Murashige and Skoog agar plates.
Figure 6.
Figure 6.
Clustering of Mitochondria in osb1 Mesophyll Cells. (A) and (B) Transmission electron microscopy of sections from variegated leaves of osb1-1 plants. Mesophyll cells from wild-type (A) and osb1-1 (B) plants, showing clusters of mitochondria in osb1-1 (arrowheads). (C) and (D) Details of mesophyll cells from osb1-1, showing clusters of mitochondria and the accumulation of mitochondria in regions of cell wall ingrowths. (E) Increase in the number and decrease in the size of mitochondria in osb1-1. The mean surface of mitochondria cross sections was obtained from the analysis of 20 electron microscopy images of wild-type and osb1-1 (M1) leaves. Error bars indicate sd. (F) Abnormal mesophyll cell in osb1-1. Bars = 2 μm in (A) and (B) and 500 nm in (C), (D), and (F).
Figure 7.
Figure 7.
Recombination of mtDNA in osb1 Mutants. (A) DNA gel blots of total flower DNA (3 μg/lane) from Col-0 and osb1-1 and osb1-2 mutants hybridized with atp9, atp1, atp6, cox2, and cob probes. Open arrowheads, RA1 recombination product; closed arrowheads, RA2 recombination product; closed circles, fragments that appear only in the mutant lines; open circles, fragments that disappear in one of the mutant plants. (B) and (C) Analysis of the recombination process affecting the atp9 gene locus. RA, RB, RC, and RD indicate repeated sequences. BamHI fragments and their sizes are indicated. Triangles indicate partial gene sequences. P1 to P9 are primers used for PCR amplification. (B) Recombination mediated by repeat RA present in the atp9 locus and upstream of cox3. The structures predicted for the most abundant heteroduplex (RA1) and the unfavored reciprocal heteroduplex (RA2) are shown. The corresponding fragments are indicated by open arrowheads in the atp9 DNA gel blot. (C) Recombination mediated by repeat RB present in the atp9 and orf315 mtDNA environments. The structures of the most abundant heteroduplex (RB1) and the unfavored reciprocal heteroduplex (RB2) are shown. The corresponding fragments are indicated by closed arrowheads in the atp9 DNA gel blot.
Figure 8.
Figure 8.
Accumulation of the RA1 Recombination Product in osb1 Mutants Affected by mtDNA Substoichiometric Shifting. (A) Simplified scheme showing the RA repeats in wild-type Col-0 atp9 and cox3 contexts and the resulting recombination products RA1 and RA2. Primers P1 to P4 (Figure 7B) were used to amplify the four mtDNA configurations. (B) Analysis by optimized competitive, three-primer PCR of three osb1-1 plants affected by shifting and of three Col-0 plants. The top band (P1 + P2) corresponds to wild-type atp9 (748 nucleotides), and the smaller fragment (P1 + P3) corresponds to the RA1 recombination product (546 nucleotides). (C) Analysis of RA1 accumulation in the first generation of osb1 homozygous mutants. The OSB1 genotype of each plant is indicated. Homozygous plants 3, 5, 9, and 11 have increased levels of RA1 (stage I shift; as described in Results and in Supplemental Table 2 online). (D) Progeny (generation T3) of homozygous plant 3 from (C): plants 1, 4, and 12 show much higher levels of RA1 than their siblings (stage II shift). (E) Analysis of plants resulting from the backcrossing, as pollen receptor, of plant 4 from (D). (F) Analysis of plants resulting from the reciprocal cross.
Figure 9.
Figure 9.
Substoichiometric Shifting Is Accompanied by the Loss of Reciprocal Recombination Products. (A) Detection of the reciprocal recombination product RA2 (bottom panel) in the progeny of a T4 plant that shows partial mtDNA shifting (stage I; top panel). (B) The same as (A), in the progeny of a plant that has a complete mtDNA shift (stage II).

References

    1. Abdelnoor, R.V., Yule, R., Elo, A., Christensen, A.C., Meyer-Gauen, G., and Mackenzie, S.A. (2003). Substoichiometric shifting in the plant mitochondrial genome is influenced by a gene homologous to MutS. Proc. Natl. Acad. Sci. USA 100 5968–5973. - PMC - PubMed
    1. Adams, K.L., and Daley, D. (2004). Plant mitochondrial genome evolution and gene transfer to the nucleus. In Plant Mitochondria: From Genome to Function, D.A. Day, A.H. Millar, and J. Whelan, eds (Dordrecht, The Netherlands: Kluwer Academic Publishers), pp. 107–120.
    1. Arrieta-Montiel, M., Lyznik, A., Woloszynska, M., Janska, H., Tohme, J., and Mackenzie, S. (2001). Tracing evolutionary and developmental implications of mitochondrial stoichiometric shifting in the common bean. Genetics 158 851–864. - PMC - PubMed
    1. Backert, S., and Börner, T. (2000). Phage T4-like intermediates of DNA replication and recombination in the mitochondria of the higher plant Chenopodium album (L.). Curr. Genet. 37 304–314. - PubMed
    1. Backert, S., Nielsen, B.L., and Börner, T. (1997). The mystery of the rings: Structure and replication of mitochondrial genomes from higher plants. Trends Plant Sci. 2 477–483.

Publication types

MeSH terms

Associated data