Clinical Trial
. 2015 Dec;173(6):777-89.
doi: 10.1530/EJE-15-0474. Epub 2015 Sep 4.

GH deficiency status combined with GH receptor polymorphism affects response to GH in children

Collaborators, Affiliations
Clinical Trial

GH deficiency status combined with GH receptor polymorphism affects response to GH in children

Armand Valsesia et al. Eur J Endocrinol. 2015 Dec.

Abstract

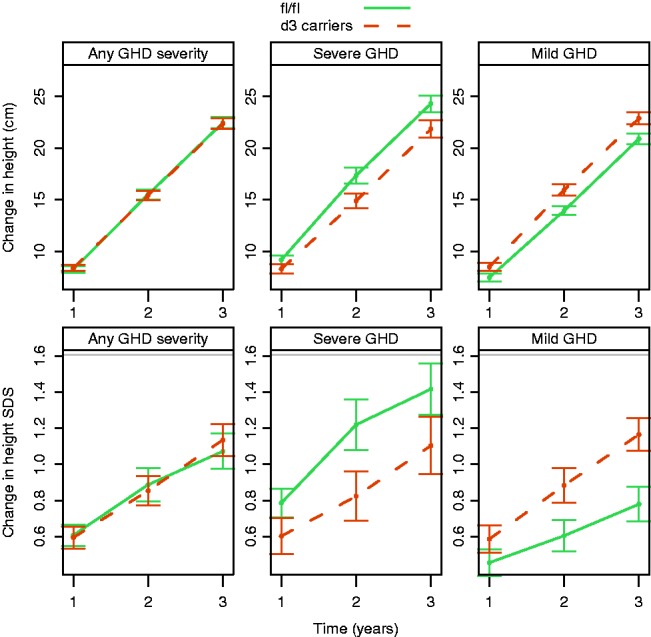
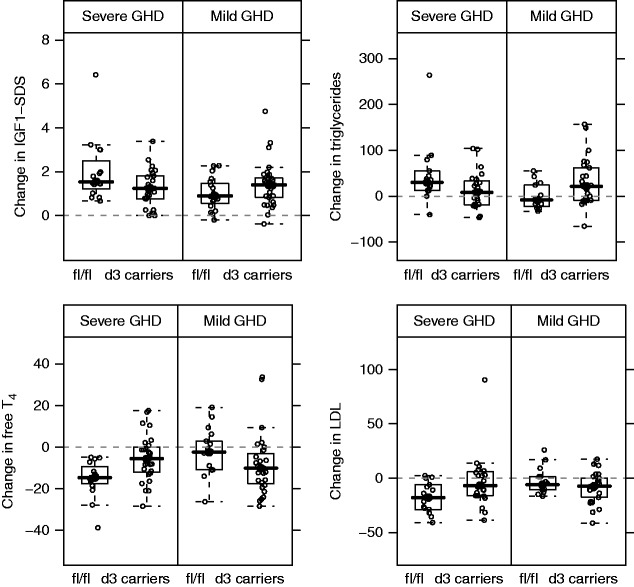
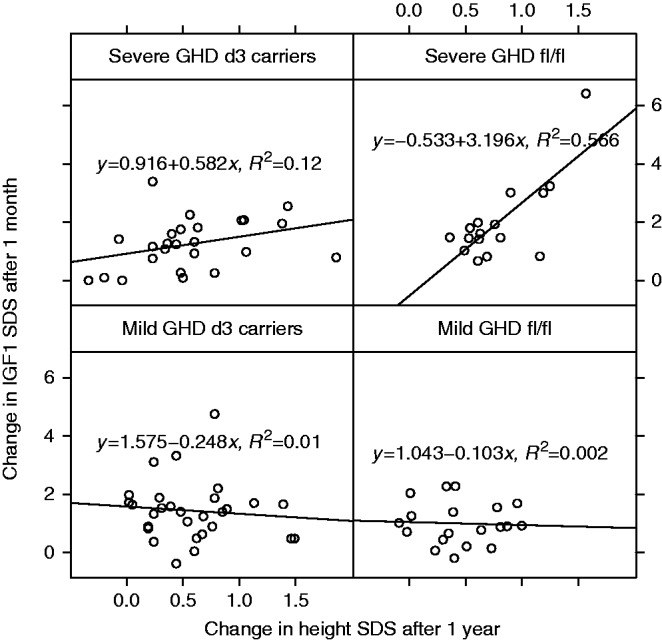
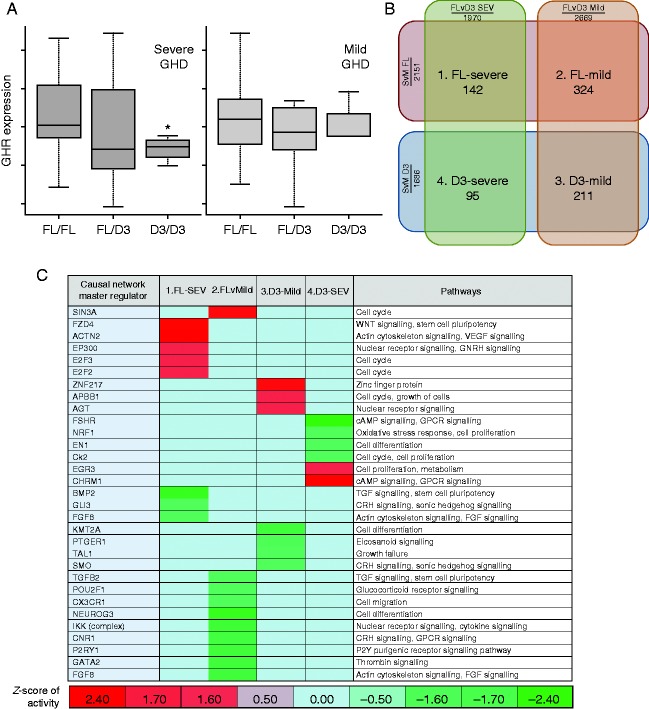
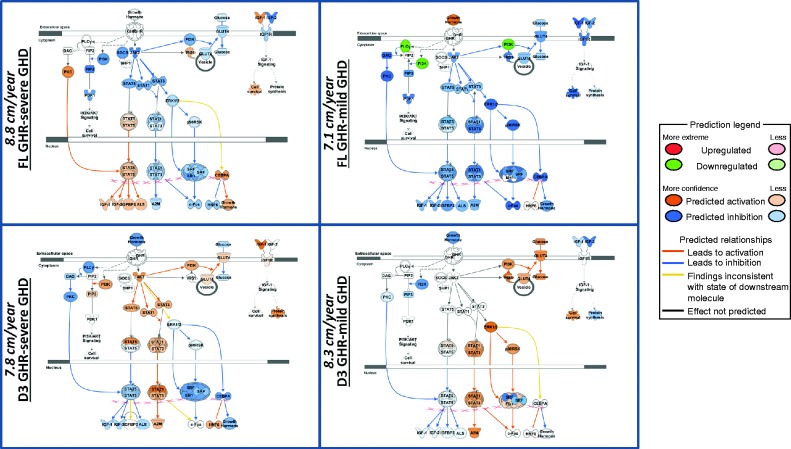
Meta-analysis has shown a modest improvement in first-year growth response to recombinant human GH (r-hGH) for carriers of the exon 3-deleted GH receptor (GHRd3) polymorphism but with significant interstudy variability. The associations between GHRd3 and growth response to r-hGH over 3 years in relation to severity of GH deficiency (GHD) were investigated in patients from 14 countries. Treatment-naïve pre-pubertal children with GHD were enrolled from the PREDICT studies (NCT00256126 and NCT00699855), categorized by peak GH level (peak GH) during provocation test: ≤4 μg/l (severe GHD; n=45) and >4 to <10 μg/l mild GHD; n=49) and genotyped for the GHRd3 polymorphism (full length (fl/fl, fl/d3, d3/d3). Gene expression (GE) profiles were characterized at baseline. Changes in growth (height (cm) and SDS) over 3 years were measured. There was a dichotomous influence of GHRd3 polymorphism on response to r-hGH, dependent on peak GH level. GH peak level (higher vs lower) and GHRd3 (fl/fl vs d3 carriers) combined status was associated with height change over 3 years (P<0.05). GHRd3 carriers with lower peak GH had lower growth than subjects with fl/fl (median difference after 3 years -3.3 cm; -0.3 SDS). Conversely, GHRd3 carriers with higher peak GH had better growth (+2.7 cm; +0.2 SDS). Similar patterns were observed for GH-dependent biomarkers. GE profiles were significantly different between the groups, indicating that the interaction between GH status and GHRd3 carriage can be identified at a transcriptomic level. This study demonstrates that responses to r-hGH depend on the interaction between GHD severity and GHRd3 carriage.


Figures

Figure 1
Figure 1
Change from baseline in height over time. Top panels show change in height (cm) and bottom panels show change in height SDS. Lines correspond to mean and error bars show the standard error of the mean. The interaction between GHRd3 polymorphism and GHD severity was significant for both endpoints (P=0.0018 and 0.010, respectively, for change in cm and SDS). GHD, growth hormone deficiency.
Figure 2
Figure 2
Change in serum biomarkers after 1 month of r-hGH therapy. Panels from top left to bottom right correspond to boxplots for change in IGF1 SDS, percentage change in fasting triglycerides (unit of measurement: mmol/l), percentage change in free T4 (pmol/l), and percentage change in fasting LDL-cholesterol (mmol/l). All interaction GHRd3 polymorphism–GHD severity terms were significantly associated with biomarker changes (FDR <5%). GHD, growth hormone deficiency; IGF1, insulin-like growth factor-I; T4, thyroxine.
Figure 3
Figure 3
Correlation between change in IGF1 SDS and change in height SDS. Correlation is stratified by GHD severity–GHRd3 polymorphism groups. The line was fitted by a linear model, and the corresponding equation including R2 value is indicated in each panel. GHD, growth hormone deficiency; IGF1, insulin-like growth factor 1.
Figure 4
Figure 4
Gene expression associated with GHD severity and carriage of the GHRd3 variant. (A) Box and whisker plots of GHR expression by genotype (median and quartiles of Affymetrix probe-set 205498_at expression) (B) Diagram showing overlap of associated gene expression with severe compared to mild GHD and carriage of full length GHR compared to carriage of GHRd3 (P<0.05, numbers represent associated gene probe sets). (C) CNA was used to define master regulators associated with the regulation of the overlapping gene expression defined in (B) (modified P value <0.05 and z-score of activity >|1.4|). Data represented as a heat map with hierarchical clustering (Euclidean metric); biological pathways associated with master regulators are shown. The colour coding represents the predicted level of activity of the master regulator – deeper red represents increasing up-regulation (e.g. ACNT2) and deeper green represents increased down-regulation (e.g. BMP2).
Figure 5
Figure 5
Predicted activity within the GH signal transduction pathways based on baseline gene expression. Each panel shows the signalling molecules in the GH pathways. The predicted level of expression (Orange, increased; Blue, decreased) of each of these molecules for each of the four GHRd3/GH status groups (FL-GHR-Severe GHD (38 genes), FL GHR-Mild GHD (64 genes), GHRd3-Mild GHD (48 genes), GHRd3-Severe GHD (20 genes)) is shown. The predicted levels of expression in the GH pathway are derived from the impact of the levels of baseline gene expression in each of the four states and their direct network interactions with the GH pathway. First year height velocity (cm/year) in each of the four states is shown in the left margin of each panel. The predicted action on the GH pathway molecules was determined using Molecular Activity Prediction (MAP) tool in IPA (see Legend below). The principal difference between GH deficient states for those with full-length GHR (top two panels) is that those with severe GHD are predicted to have an activated STAT5 pathway in the basal state. For carriage of GHRd3 (lower two panels), those with severe GHD are predicted to have inhibition in the ERK pathway in the basal state. When comparing between genotypes for both severe and mild GHD, those carrying GHRd3 have active STAT 1 and 3 pathways compared to inhibition for those with full-length GHR.

References

    1. Bakker B, Frane J, Anhalt H, Lippe B, Rosenfeld RG. Height velocity targets from the national cooperative growth study for first-year growth hormone responses in short children. Journal of Clinical Endocrinology and Metabolism. 2008;93:352–357. doi: 10.1210/jc.2007-1581. - DOI - PubMed
    1. Dos Santos C, Essioux L, Teinturier C, Tauber M, Goffin V, Bougneres P. A common polymorphism of the growth hormone receptor is associated with increased responsiveness to growth hormone. Nature Genetics. 2004;36:720–724. doi: 10.1038/ng1379. - DOI - PubMed
    1. Binder G, Baur F, Schweizer R, Ranke MB. The d3-growth hormone (GH) receptor polymorphism is associated with increased responsiveness to GH in Turner syndrome and short small-for-gestational-age children. Journal of Clinical Endocrinology and Metabolism. 2006;91:659–664. doi: 10.1210/jc.2005-1581. - DOI - PubMed
    1. Jorge AA, Marchisotti FG, Montenegro LR, Carvalho LR, Mendonca BB, Arnhold IJ. Growth hormone (GH) pharmacogenetics: influence of GH receptor exon 3 retention or deletion on first-year growth response and final height in patients with severe GH deficiency. Journal of Clinical Endocrinology and Metabolism. 2006;91:1076–1080. doi: 10.1210/jc.2005-2005. - DOI - PubMed
    1. Raz B, Janner M, Petkovic V, Lochmatter D, Eble A, Dattani MT, Hindmarsh PC, Fluck CE, Mullis PE. Influence of growth hormone (GH) receptor deletion of exon 3 and full-length isoforms on GH response and final height in patients with severe GH deficiency. Journal of Clinical Endocrinology and Metabolism. 2008;93:974–980. doi: 10.1210/jc.2007-1382. - DOI - PubMed

Publication types

MeSH terms

Associated data