. 2016 May 30;213(6):1011-28.
doi: 10.1084/jem.20151183. Epub 2016 May 16.

A nonsense mutation in the DNA repair factor Hebo causes mild bone marrow failure and microcephaly

Affiliations

A nonsense mutation in the DNA repair factor Hebo causes mild bone marrow failure and microcephaly

Shu Zhang et al. J Exp Med. .

Abstract

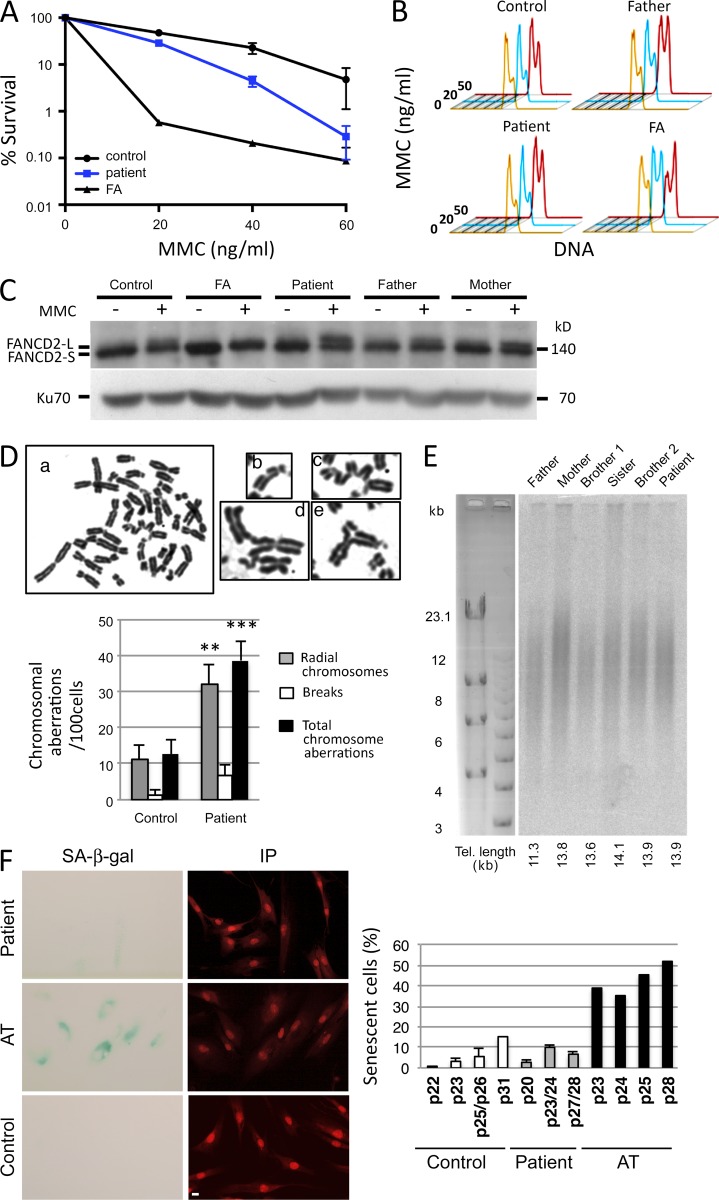
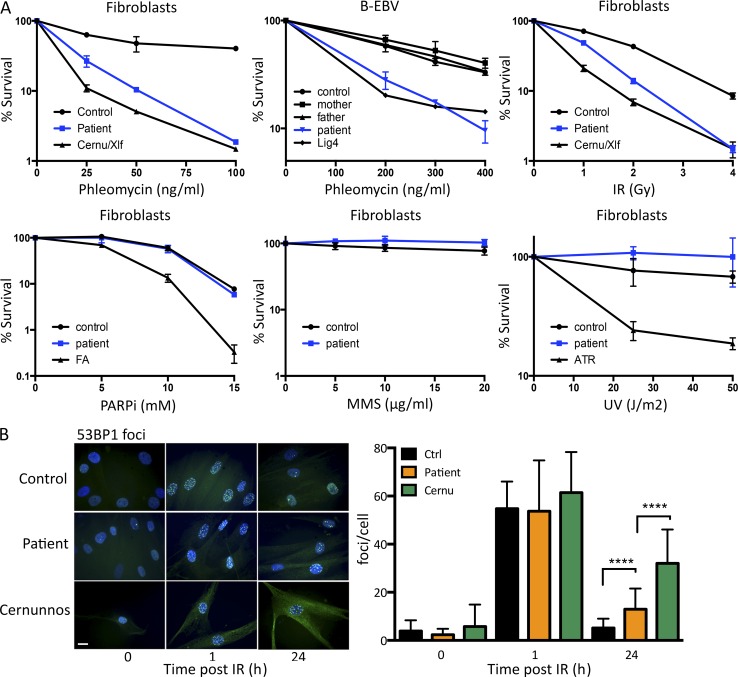
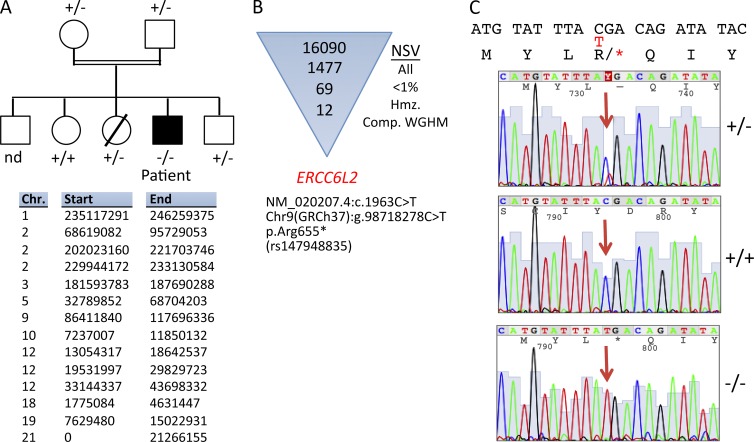
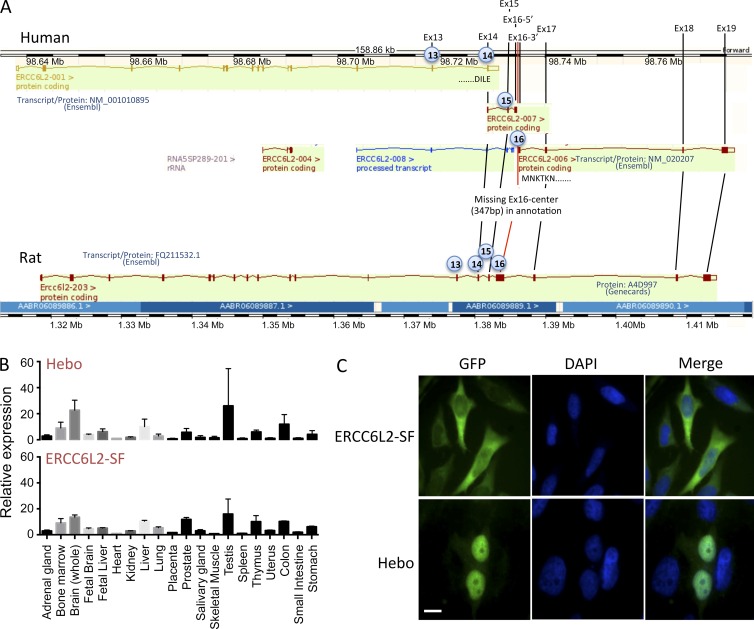
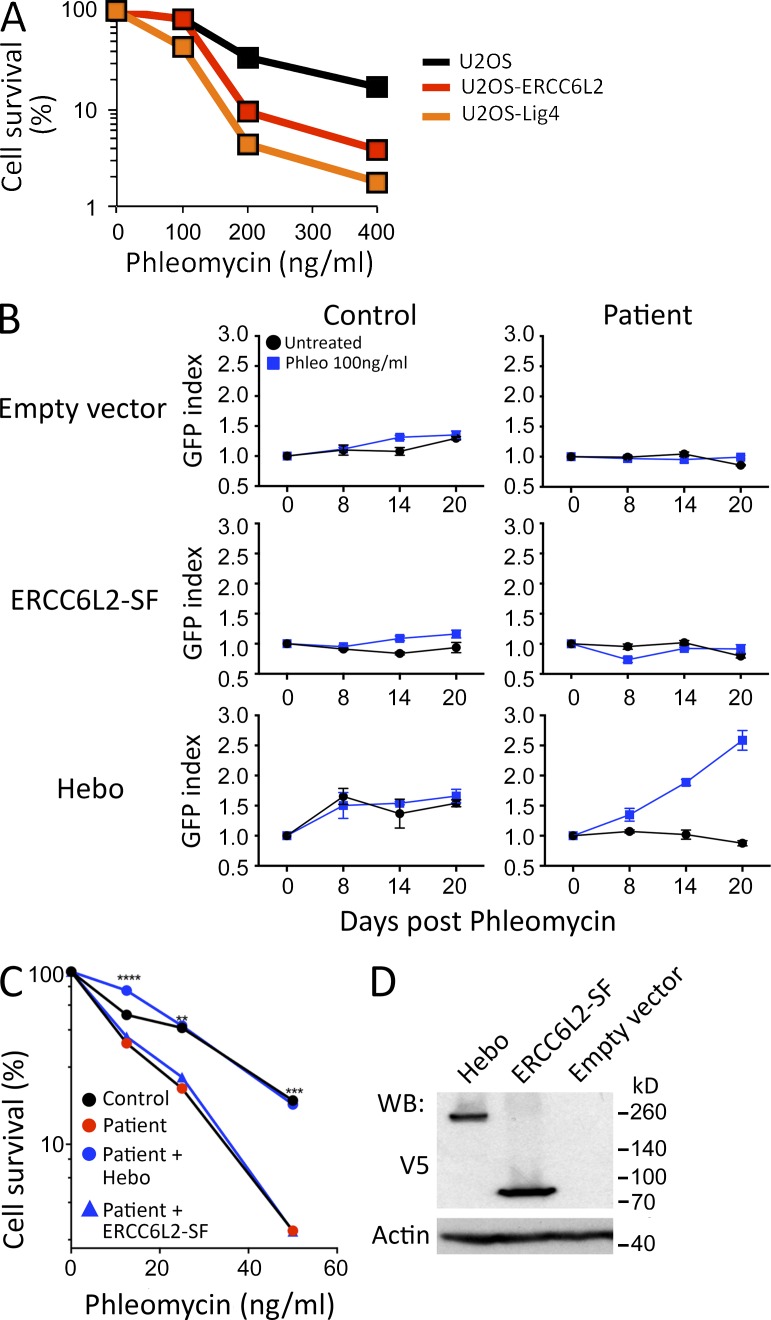
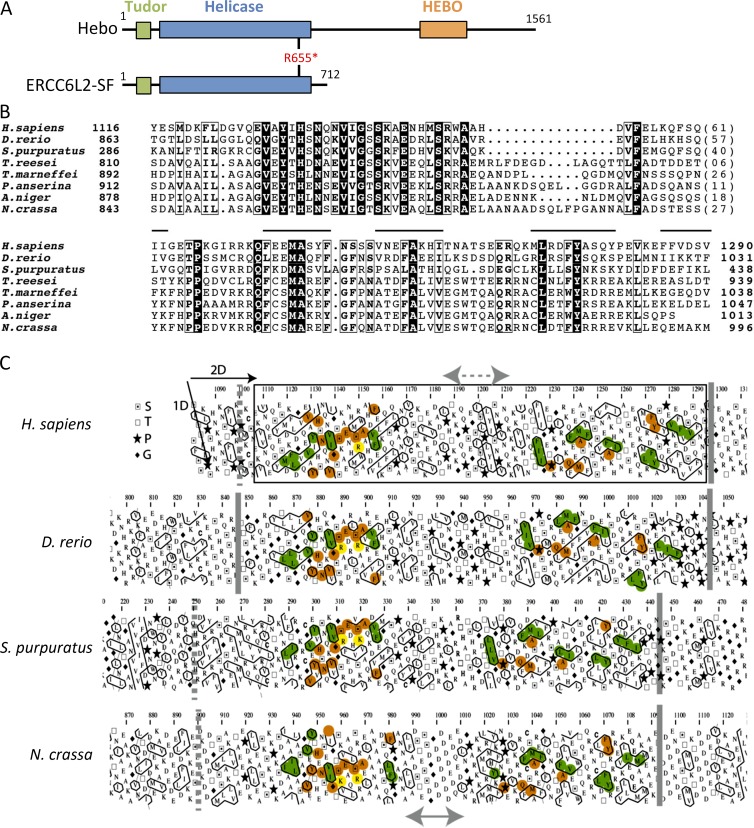
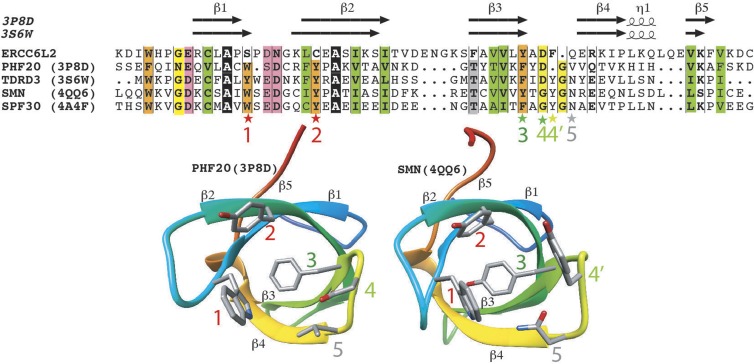
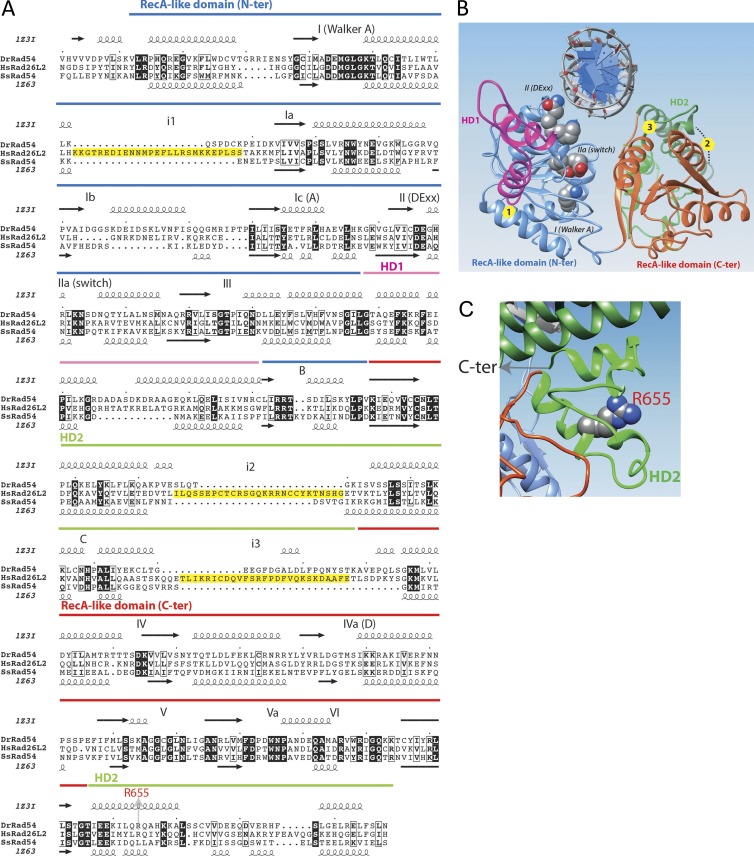
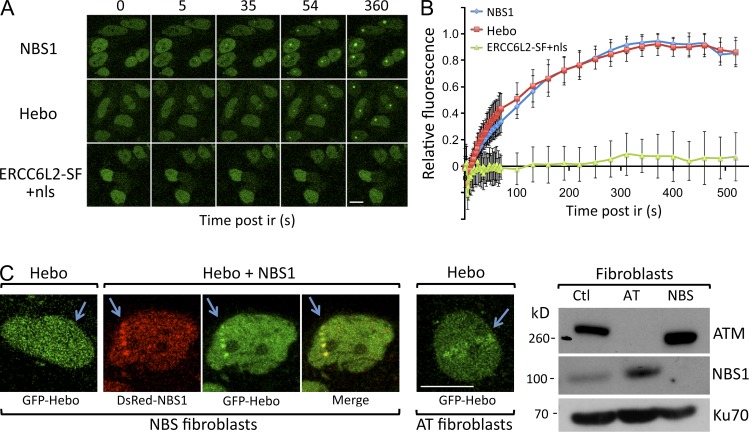
Inherited bone marrow failure syndromes are human conditions in which one or several cell lineages of the hemopoietic system are affected. They are present at birth or may develop progressively. They are sometimes accompanied by other developmental anomalies. Three main molecular causes have been recognized to result in bone marrow failure syndromes: (1) defects in the Fanconi anemia (FA)/BRCA DNA repair pathway, (2) defects in telomere maintenance, and (3) abnormal ribosome biogenesis. We analyzed a patient with mild bone marrow failure and microcephaly who did not present with the typical FA phenotype. Cells from this patient showed increased sensitivity to ionizing radiations and phleomycin, attesting to a probable DNA double strand break (dsb) repair defect. Linkage analysis and whole exome sequencing revealed a homozygous nonsense mutation in the ERCC6L2 gene. We identified a new ERCC6L2 alternative transcript encoding the DNA repair factor Hebo, which is critical for complementation of the patient's DNAdsb repair defect. Sequence analysis revealed three structured regions within Hebo: a TUDOR domain, an adenosine triphosphatase domain, and a new domain, HEBO, specifically present in Hebo direct orthologues. Hebo is ubiquitously expressed, localized in the nucleus, and rapidly recruited to DNAdsb's in an NBS1-dependent manner.


Figures

Figure 1.
Figure 1.
FA-like phenotype. (A) MMC sensitivity of SV40-transformed fibroblasts from the patient, FA, and control. (B) G2/M arrest in EBV lymphoblastoid B cells from the patient, his father, an unrelated healthy control, and an FA patient. Cells were either untreated (orange) or treated with 20 ng/ml (blue) or 50 ng/ml (red) MMC for 48 h. (C) Ubiquitination of FANCD2 after MMC treatment (150 ng/ml for 48 h) of EBV B cells from the patient, his parents, an unrelated healthy control, and an FA patient. (A–C) The experiment was performed three times. (D) Increase of chromosomal aberrations in cells from the patient after MMC treatment. Representative metaphase from SAS50 fibroblasts treated with MMC (50 ng/ml for 24 h). (a) Examples of chromosomal aberrations found in metaphase from the patient’s fibroblasts. (b) Chromosomal breaks. (c–e) Radial chromosomes. The histogram shows the frequency of chromosomal aberrations (i.e., breaks, radial chromosomes, and total aberrations) found in metaphase spreads from patient fibroblasts compared with normal fibroblasts at similar passage. Data are mean ± SEM. n = 75 and 71 metaphases, respectively. **, P = 0.002; ***, P = 0.0003 for Student’s t tests. This experiment was performed two times. (E) Estimation of telomere (Tel.) length from whole blood cells by terminal restriction fragment analysis. This Southern blot has been performed once. (F) Representative image of the SA–β-gal staining (cyan) in patient fibroblasts and in AT fibroblasts to measure cellular senescence. Nuclei were stained with propidium iodide (IP; red). Quantification of the percentage of SA–β-gal–positive cells versus total cells determined at different cell culture passages (p) in the different fibroblast cultures (control, patient, and AT). The percentage of SA–β-gal–positive cells in patient’s cultures remains at a low level (<11.5% at p28) compared to that of control cultures (15% at passage p31), whereas AT cells, known to present a premature senescent phenotype, exhibited a strong percentage of SA–β-gal–positive cells at earlier passages (39% at p23). This experiment was performed two times. Bar, 10 µm.
Figure 2.
Figure 2.
DNA repair defect in patient’s cells. (A) Survival of SV40-transformed and EBV B cell lines from the patient and appropriate negative controls upon treatment with increasing doses of various genotoxic agents. These experiments were performed between one and four times depending on the drug. PARPi, poly–ADP-ribose polymerase inhibitor. MMS, methyl methanesulfonate. ATR, AT and rad3-related protein. (B) Kinetics of irradiation-induced 53BP1 foci formation in primary fibroblasts from the patient, a healthy control, and a Cernunnos-mutated patient. A representative image of cells treated with 2 Gy IR and quantification of IRIF is shown. Data are mean ± SD. ****, P < 0.0001 for a Mann-Whitney test. This experiment was performed two times. Bar, 10 µm. Ctrl, control. Cernu, Cernunnos.
Figure 3.
Figure 3.
Genetic analysis. (A) Pedigree of the family and candidate chromosome (Chr.) regions (GRCh37/hg19) identified by linkage analysis in the patient’s family by WGHM. nd, not determined. (B) Identification of NSV in the ERCC6L2 after filtering of WES NSV to homozygous (hmz.) regions as defined by WGHM and with a frequency <1% in various NSV databases. Comp., compatible. (C) Representative electropherogram of Sanger resequencing covering the three genotypes of the ERCC6L2 mutation identified in the family. The red T indicates the nucleotide change relative to the C above it. The arrows indicate the position of the nucleotide change on the electropherogram. Asterisks indicate stop condons.
Figure 4.
Figure 4.
Identification of Hebo. (A) Schematic representation of the annotated ERCC6L2 gene in human (top) and rat (bottom) as provided by the Ensembl database. Exons 1–14 correspond to the human SF of ERCC6L2. A splice donor site within exon 14 would lead to alternative splicing from transcript 001 to transcript 007, incorporating new exon 15 and part of exon 16. Annotation is interrupted in exon 16 in transcript 007. Transcript 006 would incorporate the end of exon 16 onward to the end of the putative cDNA at exon 19 when compared with the structure of the rat gene. A gap of 347 bp between the two parts of exon 16 present in transcripts 007 and 006, respectively, was filled in through PCR amplification of cDNA. The existence of the ERCC6L2 long form (Hebo) was validated through full-length PCR amplification of cDNA. (B) Real-time quantitative RT-PCR of ERCC6L2-SF and Hebo-specific transcripts in a panel of tissues. This experiment was performed two times. Data are mean ± SEM. (C) Cellular localization of GFP-Hebo and GFP–ERCC6L2-SF in 293T-transfected cells. This experiment was performed three times. Bar, 10 µm.
Figure 5.
Figure 5.
Functional complementation. (A) Phleo sensitivity of U20S cells, in which the ERCC6L2 gene has been disrupted through CRISPR/Cas9 technology, compared with the sensitivity of the WT parental cells and a U2OS line with mutated DNA ligase IV. This experiment was performed three times. (B) Functional complementation of phleo sensitivity provided by WT Hebo transduced into the patient’s cells as compared with the ERCC6L2-SF or empty vector. A mix population of transduced (GFP+) and untransduced (GFP) was analyzed through multicolor competition assay (Smogorzewska et al., 2007). The selective growth advantage is scored as the increase in the index of GFP-positive cells/GFP-negative cells at various times compared with the initiation of the culture (index = 1). This experiment was performed two times. Data are mean ± SEM. (C) Sensitivity of the patient’s cells to phleo after Hebo, ERCC6L2-SF, or mock transduction. **, P < 0.01; ***, P < 0.001; ****, P < 0.0001 for a Mann-Whitney test. This experiment was performed three times. (D) Expression level of Hebo and ERCC6L2-SF after transient transfection into 293T cells, revealed with anti-V5 antibody. WB, Western blot.
Figure 6.
Figure 6.
The HEBO domain. (A) Schematic representation of the Hebo and ERCC6L2-SF domain architecture. The asterisk indicates the stop codon at R655 in the patient. (B) Multiple alignment of the HEBO domain sequence of Hebo proteins from representative species. Identical amino acids are represented as white on a black background, and amino acid similarities are boxed. Lines indicate the position of hydrophobic clusters, which are conserved within the whole family (Table S1). GenBank/NCBI RefSeq accession nos. are NP_064592.2 (Homo sapiens), AAH91795.1 (Danio rerio), XP_011663528 (Strongylocentrotus purpuratus), XP_006968442.1 (Trichoderma reesei), XP_002151909.1 (Talaromyces marneffei), CDP26308.1 (Podospora anserina), XP_001391908.1 (Aspergillus niger), and CAD37001.1 (Neurospora crassa). (C) Hydrophobic cluster analysis of the C-terminal region of ERCC6L6 reveals a globular domain (boxed), which is conserved in the ERCC6L2 orthologues. The sequences are shown on duplicated α-helical nets, on which hydrophobic amino acids are contoured and form clusters, which mainly correspond to the regular secondary structures forming globular domains. Conservation of hydrophobic clusters is indicated in green, whereas sequence identities are reported in orange. A more variable region (arrows) is highlighted in the middle of the domain, likely corresponding either to a large loop or to a linker separating two distinct subdomains. S, T, P, and G stand for serine, threonine, proline, and glycine, respectively. Orange and yellow colorings are used to designate identical and similar amino acids, respectively.
Figure 7.
Figure 7.
ERCC6L2/Hebo TUDOR domain. (Top) Alignment of the TUDOR domain of human ERCC6L2 with sequences of TUDOR domains of known 3D structures. Protein Data Bank identifiers are given after the protein names. Secondary structures, as observed in the experimental 3D structures of PHF20 and TDRD3, are reported above the sequences. Colors are used to represent highly conserved positions: orange, aromatic; yellow, loop forming; green, hydrophobic; pink, acidic. Stars designate amino acids participating in the aromatic binding cage. Red stars, aromatic amino acids that are conserved in the experimental 3D structures but not in ERCC6L2. Dark green star, aromatic amino acid that is strictly conserved in all the sequences shown. Light green stars, two positions that can be substituted for each other in the cage depending on the considered domain. Gray star, nonaromatic position participating in the cage. (Bottom) Ribbon representations of the 3D structures of PHF20 and survival of motor neurons, highlighting the positions of the amino acids participating in the methyl-binding cage (labeled 1–5).
Figure 8.
Figure 8.
ERCC6L2/Hebo ATPase domain. (A) Sequence alignment of the human ERCC6L2 SWI/SNF2 ATPase domain with those of the Rad54 proteins of known 3D structures (D. rerio, Protein Data Bank accession no. 1z3i [Thomä et al., 2005]; and Sulfolobus solfataricus, Protein Data Bank accession no. 1z63 [Dürr et al., 2005]). SWI2/SNF2-specific elements are depicted in magenta (HD1) and green (HD2), whereas the RecA-like helicase domains are blue (lobe1) and red (lobe2). Helicase-specific domains are shown with numbers, and SWI-SNF2–specific elements are depicted with letters (Thomä et al., 2005). Yellow boxes (alignment) indicate the positions of insertions in the ERCC6L2 structure relative to the Rad54 templates. (B) Global view of the 3D structure model (ribbon representation) of the human ERCC6L2 SWI/SNF2 ATPase domain, constructed on the basis of its alignment with sequences of known 3D structures (see A). The same colors are used as in A. Circles (3D structure) indicate the positions of insertions in the ERCC6L2 structure relative to the Rad54 templates (yellow boxes in A). (C) Focus on the HD2 domain showing the location of arginine 655. N-ter, N-terminal. C-ter, C-terminal.
Figure 9.
Figure 9.
Recruitment of Hebo to DNA damage. (A) Snapshots of recruitment of NBS1, Hebo, and nls–ERCC6L2-SF to DNA damage upon laser microirradiation of HeLa-transfected cells. This experiment was performed five times. (B) Kinetics of recruitment of NBS1 and Hebo to DNA damage upon laser microirradiation. This experiment was performed twice. Data are mean ± SEM. (C) Fibroblasts from an NBS1-deficient patient were transfected with GFP-Hebo with or without DsRed-NBS1 and subjected to laser microirradiation. No Hebo recruitment was detected in the absence of NBS1. GFP-Hebo transfected in ATM-deficient fibroblasts localized normally to DNA damage upon laser microirradiation. Both experiments were performed twice. The Western blot confirms the genetic status of NBS1- and ATM-deficient cell lines. Bars, 10 µm. Ctl, control. Arrows indicate the location of the laser microirradiation.
Figure 10.
Figure 10.
Role of Hebo in NHEJ and HR. (A) Analysis of SJ fidelity after V(D)J recombination (V[D]J rec.) of the pRec-SJ substrate in healthy control and patient’s fibroblasts and fibroblasts from a Cernunnos (Cernu)-deficient patient. SJs were PCR amplified and sequenced using single molecule sequencing by Next Generation Sequencing. The frequency of precise SJs was scored in three independent experiments. (B) Analysis of HR using the U2OS-DRGFP system. Hebo and RAD51 were down-regulated by siRNA transfection, and HR was evaluated in six independent experiments after transfection of I-SceI–expressing plasmid. HR is scored by determining the frequency of GFP-positive cells 48 h after transfection. Statistics were analyzed by Mann-Whitney t tests. Data are mean ± SEM. Rel., relative.

References

    1. Alt F.W., Zhang Y., Meng F.L., Guo C., and Schwer B.. 2013. Mechanisms of programmed DNA lesions and genomic instability in the immune system. Cell. 152:417–429. 10.1016/j.cell.2013.01.007 - DOI - PMC - PubMed
    1. Altschul S.F., Madden T.L., Schäffer A.A., Zhang J., Zhang Z., Miller W., and Lipman D.J.. 1997. Gapped BLAST and PSI-BLAST: a new generation of protein database search programs. Nucleic Acids Res. 25:3389–3402. 10.1093/nar/25.17.3389 - DOI - PMC - PubMed
    1. Auerbach A.D. 2009. Fanconi anemia and its diagnosis. Mutat. Res. 668:4–10. 10.1016/j.mrfmmm.2009.01.013 - DOI - PMC - PubMed
    1. Avagyan S., Churchill M., Yamamoto K., Crowe J.L., Li C., Lee B.J., Zheng T., Mukherjee S., and Zha S.. 2014. Hematopoietic stem cell dysfunction underlies the progressive lymphocytopenia in XLF/Cernunnos deficiency. Blood. 124:1622–1625. 10.1182/blood-2014-05-574863 - DOI - PMC - PubMed
    1. Botuyan M.V., Lee J., Ward I.M., Kim J.E., Thompson J.R., Chen J., and Mer G.. 2006. Structural basis for the methylation state-specific recognition of histone H4-K20 by 53BP1 and Crb2 in DNA repair. Cell. 127:1361–1373. 10.1016/j.cell.2006.10.043 - DOI - PMC - PubMed

Publication types

MeSH terms

Associated data