

Genome reduction in Leptospira borgpetersenii reflects limited transmission potential
- PMID: 16973745
- PMCID: PMC1599999
- DOI: 10.1073/pnas.0603979103
Genome reduction in Leptospira borgpetersenii reflects limited transmission potential
Abstract
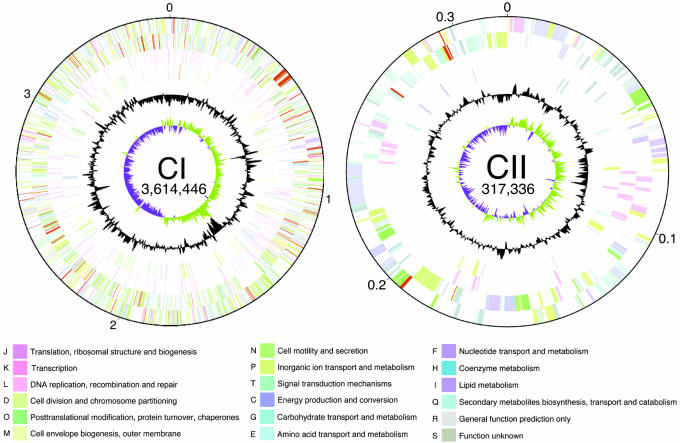
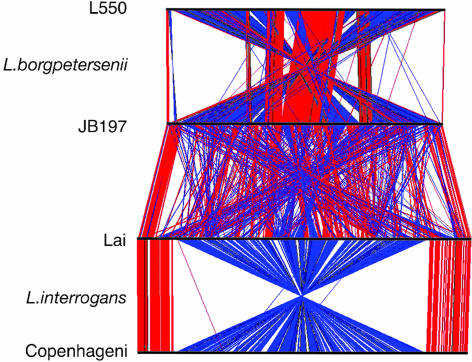
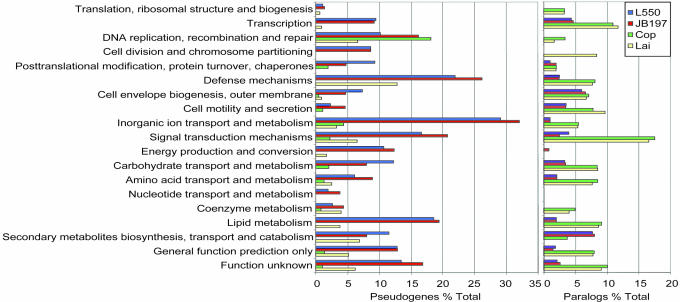
Leptospirosis is one of the most common zoonotic diseases in the world, resulting in high morbidity and mortality in humans and affecting global livestock production. Most infections are caused by either Leptospira borgpetersenii or Leptospira interrogans, bacteria that vary in their distribution in nature and rely on different modes of transmission. We report the complete genomic sequences of two strains of L. borgpetersenii serovar Hardjo that have distinct phenotypes and virulence. These two strains have nearly identical genetic content, with subtle frameshift and point mutations being a common form of genetic variation. Starkly limited regions of synteny are shared between the large chromosomes of L. borgpetersenii and L. interrogans, probably the result of frequent recombination events between insertion sequences. The L. borgpetersenii genome is approximately 700 kb smaller and has a lower coding density than L. interrogans, indicating it is decaying through a process of insertion sequence-mediated genome reduction. Loss of gene function is not random but is centered on impairment of environmental sensing and metabolite transport and utilization. These features distinguish L. borgpetersenii from L. interrogans, a species with minimal genetic decay and that survives extended passage in aquatic environments encountering a mammalian host. We conclude that L. borgpetersenii is evolving toward dependence on a strict host-to-host transmission cycle.
Conflict of interest statement
The authors declare no conflict of interest.
Figures
References
-
- World Health Organization. Wkly Epidemiol Rec. 1999;74:237–242. - PubMed
-
- Brenner DJ, Kaufmann AF, Sulzer KR, Steigerwalt AG, Rogers FC, Weyant RS. Int J Sys Bacteriol. 1999;49:839–858. - PubMed
-
- McBride AJ, Athanazio DA, Reis MG, Ko AI. Curr Opin Infect Dis. 2005;18:376–386. - PubMed
-
- Faine S, Adler B, Bolin C, Perolat P. Leptospira and Leptospirosis. Melbourne, Australia: MediSci; 1999.
Publication types
MeSH terms
Substances
Associated data
- Actions
- Actions
- Actions
- Actions
LinkOut - more resources
Full Text Sources
Other Literature Sources
Molecular Biology Databases
