. 2024 Dec 10;15(1):10143.
doi: 10.1038/s41467-024-54418-4.

Genomic perspective on the bacillus causing paratyphoid B fever

Affiliations

Genomic perspective on the bacillus causing paratyphoid B fever

Jane Hawkey et al. Nat Commun. .

Abstract

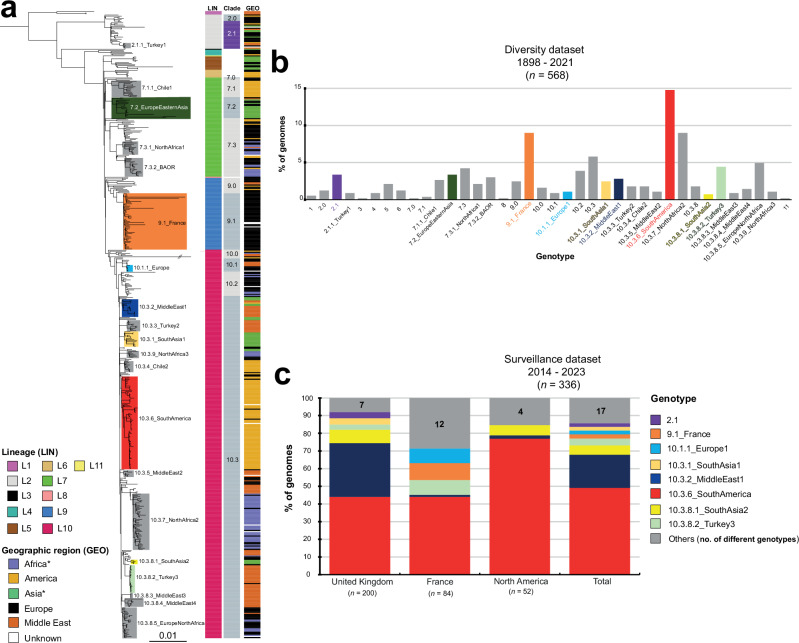
Paratyphoid B fever (PTB) is caused by an invasive lineage (phylogroup 1, PG1) of Salmonella enterica serotype Paratyphi B (SPB). However, little was known about the global population structure, geographic distribution, and evolution of this pathogen. Here, we report a whole-genome analysis of 568 historical and contemporary SPB PG1 isolates, obtained globally, between 1898 and 2021. We show that this pathogen existed in the 13th century, subsequently diversifying into 11 lineages and 38 genotypes with strong phylogeographic patterns. Following its discovery in 1896, it circulated across Europe until the 1970s, after which it was mostly reimported into Europe from South America, the Middle East, South Asia, and North Africa. Antimicrobial resistance recently emerged in various genotypes of SPB PG1, mostly through mutations of the quinolone-resistance-determining regions of gyrA and gyrB. This study provides an unprecedented insight into SPB PG1 and essential genomic tools for identifying and tracking this pathogen, thereby facilitating the global genomic surveillance of PTB.


Conflict of interest statement

Competing interests: The authors declare no competing interests.

Figures

Fig. 1
Fig. 1. Phylogeny, temporal, geographic, and source distribution of the 568 SPB-PG1 isolates from the diversity set (1898 – 2021).
a Circular maximum likelihood phylogeny (rooted on ancestral lineage L1 genome NCTC 8299) for the 568 SPB- PG1 isolates from the diversity dataset. The double slash (//) indicates an artificial shortening of this branch for visualisation. The rings show the associated information for each isolate, according to its position in the phylogeny, from the innermost to outermost, in the following order: (1) lineage (LIN); (2) geographic region (GEO); (3) and source (SOU). Lineages are labelled LX, where X is the lineage number. Lineages L3, L8, and L11, which contain only singletons are not labelled. The tips of the tree are highlighted according to lineage with a lighter hue of the colour used in the innermost ring (LIN). The scale bar indicates the number of substitutions per variable site (SNVs). b The stacked bar chart on the left shows the distribution of the 568 isolates by geographic region and time period, and the stacked bar chart on the right shows the frequencies of the lineages for the same time periods. c Number of isolates per country (map) and frequencies of the lineages by world region (pie charts). An asterisk indicates the reassignment of some African and Asian countries to the Middle East (see Table 1). The map was drawn in R with the “ggplot2” package world map data from Wickham H (2016). ggplot2: Elegant Graphics for Data Analysis. Springer-Verlag New York. ISBN 978- 3-319-24277-4, https://ggplot2.tidyverse.org. Source data are provided as a Source Data file.
Fig. 2
Fig. 2. Identification of the 38 hierarchical genotypes of SPB- PG1 and their distribution between the diversity and surveillance datasets.
a Maximum likelihood phylogeny for the 568 SPB- PG1 isolates (as in Fig. 1a, but not circular). The main genotypes are labelled and coloured. Columns on the right indicate the lineage (LIN) (see inset legend), clade and geographic origin (GEO) (see inset legend) of the isolates. An asterisk indicates the reassignment of some African and Asian countries to the Middle East (see Table 1). b Frequencies of the 38 genotypes for the 568 genomes of the diversity dataset. The colours are similar to those used in panel “a”. c Stacked bars indicate the relative abundance of each genotype — coloured as in the legend, inset — for the 336 recent isolates from the UK, France and North America (surveillance dataset). Source data are provided as a Source Data file.
Fig. 3
Fig. 3. Timed phylogeny of a representative subsample of 256 SPB- PG1 isolates.
a Maximum clade credibility tree produced with BEAST2 (optimised relaxed clock model; Bayesian skyline) with the tips coloured according to the geographic origin of the isolates (see inset). Selected nodes supported by posterior probability values > 0.9 are shown as blue triangles. The estimated age of the MRCA (with 95% confidence intervals in parentheses) is shown. The lineage of these isolates is indicated at the right side of the tree. The scale bar indicates the number of substitutions per variable site (SNVs). An asterisk indicates the reassignment of some African and Asian countries to the Middle East (see Table 2). b Bayesian skyline plot showing temporal changes in effective population size (Ne) (black curve) with 95% confidence intervals (grey shading).
Fig. 4
Fig. 4. Correlation between genome and phage-typing data for SPB- PG1.
a Maximum likelihood phylogeny (as in Fig. 1a) showing the 254 isolates from the diversity dataset that were phage-typed and their phage types (PT, see legend, inset). b Circular plot illustrating the correspondence between phage type and lineage for each of these 254 isolates. The flow chart bars are coloured according to the lineage (see the legend in the inset of panel “a”). The number of isolates is also indicated for each phage type and lineage. Source data are provided as a Source Data file.
Fig. 5
Fig. 5. Genomic characterization of antibiotic resistance genes in SPB- PG1.
Distribution of antibiotic resistance genes by phylogeny (as in Fig. 3a), geography, and time period. Genes acquired via horizontal gene transfer are indicated in black and those acquired via chromosomal mutation are indicated in blue. An asterisk indicates the reassignment of some African and Asian countries to the Middle East (Table 1).
Fig. 6
Fig. 6. Lineage-specific accumulation of sopE prophages in SPB- PG1.
a Three insertion sites occupied by sopE prophages were identified in the 14 complete genomes of SPB- PG1 isolates. Prophages of the SEN34 family [40.89–44.3 kb] were found at insertion sites #1 and/or #2. The P88-family prophage [34.3 kb] was found at insertion site #3. Further details concerning the insertion sites are available from Supplementary Data 8. Gene arrow maps were generated with the gggenes v.0.5.0 and ggplot2 v.3.4.2 packages of R v.4.1.2 software. b The 568 genomes from the diversity dataset were screened for an absence of insertions at sites #1, #2 and #3. Presence/absence is colour-coded in black and light grey, respectively; dark grey indicates the presence of a potential sopE-free prophage. Six types of prophage insertion were recorded across the 11 lineages (Supplementary Data 9).

References

    1. Achard, C. & Bensaude, R. Infections paratyphoïdiques. Bull. Mem. Soc. Hop. Paris13, 820–833 (1896).
    1. Gwyn, N. B. On infection with a para-colon bacillus in a case with all the clinical features of typhoid fever. Bull. Johns. Hopkins Hosp.9, 54–56 (1898).
    1. Hirschfeld, L. A new germ of paratyphoid. Lancet193, 296–297 (1919).
    1. Pratt, J. H. On paratyphoid fever and its complications. Boston Med. Surg.148, 137–142 (1903).
    1. Proescher, F. & Roddy, J. A. Bacteriological studies on paratyphoid A and paratyphoid B. Arch. Intern. Med.3, 263–312 (1910).

Publication types

Substances

LinkOut - more resources