. 2012;7(2):e31839.
doi: 10.1371/journal.pone.0031839. Epub 2012 Feb 21.

Multifunctional adaptive NS1 mutations are selected upon human influenza virus evolution in the mouse

Affiliations

Multifunctional adaptive NS1 mutations are selected upon human influenza virus evolution in the mouse

Nicole E Forbes et al. PLoS One. 2012.

Abstract

The role of the NS1 protein in modulating influenza A virulence and host range was assessed by adapting A/Hong Kong/1/1968 (H3N2) (HK-wt) to increased virulence in the mouse. Sequencing the NS genome segment of mouse-adapted variants revealed 11 mutations in the NS1 gene and 4 in the overlapping NEP gene. Using the HK-wt virus and reverse genetics to incorporate mutant NS gene segments, we demonstrated that all NS1 mutations were adaptive and enhanced virus replication (up to 100 fold) in mouse cells and/or lungs. All but one NS1 mutant was associated with increased virulence measured by survival and weight loss in the mouse. Ten of twelve NS1 mutants significantly enhanced IFN-β antagonism to reduce the level of IFN β production relative to HK-wt in infected mouse lungs at 1 day post infection, where 9 mutants induced viral yields in the lung that were equivalent to or significantly greater than HK-wt (up to 16 fold increase). Eight of 12 NS1 mutants had reduced or lost the ability to bind the 30 kDa cleavage and polyadenylation specificity factor (CPSF30) thus demonstrating a lack of correlation with reduced IFN β production. Mutant NS1 genes resulted in increased viral mRNA transcription (10 of 12 mutants), and protein production (6 of 12 mutants) in mouse cells. Increased transcription activity was demonstrated in the influenza mini-genome assay for 7 of 11 NS1 mutants. Although we have shown gain-of-function properties for all mutant NS genes, the contribution of the NEP mutations to phenotypic changes remains to be assessed. This study demonstrates that NS1 is a multifunctional virulence factor subject to adaptive evolution.


Conflict of interest statement

Competing Interests: The authors have declared that no competing interests exist.

Figures

Figure 1
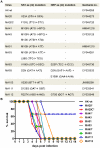
Figure 1. MA viruses with NS mutations demonstrate enhanced virulence in the mouse.
(A) Table of MA viruses indicating mutations in the NS gene segment at the protein (aa) and mRNA level (nt) as well as MLD50 value in CD-1 mice. (B) Kill curve of MA viruses with NS mutations. CD-1 mice were infected with 1×10⁷ PFU dose (1×10⁶ PFU dose used for viruses indicated with an *) and survival was monitered for 14 days.
Figure 2
Figure 2. Mouse adapted NS1 mutations increase virulence in CD-1 mice.
Groups of 5 female CD-1 mice were infected intranasally with 5×10⁶ PFU dose of rHK NS MA or HK-wt virus. formula image NS1 mutant M106V + M124I was inoculated at dose of 2.5×10⁶ PFU due to insufficient viral stock titre. Survival (A) and body weight loss (B) were monitored for 14 dpi. Percent body weight is expressed as the mean value of 5 (or total number alive) mice (*p<0.05, **p<0.01, ***p<0.001; two-tailed unequal variance paired student's t-test for days 1–6). Experimental endpoint was defined as >30% body weight loss and respiratory distress. Graphical analysis of data was broken into three mutant sets, with rHK-wt included in each, due to the number of mutants surveyed.
Figure 3
Figure 3. Mouse adapted NS1 mutations increase pathology and virus spread in the mouse lung.
Groups of 4 CD-1 mice were infected with 1×10⁵ PFU dose of selected rHK NS mutant or rHK-wt viruses and two sets of lungs were collected at both 2 and 6 dpi. IF: Virus was detected by immunofluorescence; frozen lung sections were stained with anti-HK primary antibody, Cy3- conjugated secondary antibody (red), and nuclei were stained with Hoeschst (blue). Images were taken using a 20× objective lens. White arrows indicate foci of staining at 6 dpi. H&E: Lung pathology was assessed by H&E staining. Images were taken using a 10× objective lens.
Figure 4
Figure 4. Mouse-adapted NS1 mutations affect IFN-β production and viral yield in the mouse lung.
Groups of 6–12 female CD-1 mice were infected intranasally with 1×10⁵ PFU dose of rHK NS mutants or rHK-wt or mock-infected with PBS. Lungs were collected 1 and 3 days pi, homogenized, and quantified for IFN β concentration using a commercial murine IFN β ELISA kit (left panel), and for viral titre by plaque assay on MDCK cells (right panel) Data represent the means ± SD (*p<0.05, **p<0.01, ***p<0.001, ****p<0.0001; two-tailed unequal variance student's t-test).
Figure 5
Figure 5. Mouse-adapted NS1 mutants affect binding affinity to CPSF30-F2F3.
(A) Map of NS1 protein indicating the location of NS1 mutations selected upon adaption of A/Hong Kong/1/1968 (H3N2) to the mouse, as depicted by black arrows. NS1 binding domains are depicted within and below the protein diagram. (B) NS1 proteins (wt or mutant) as well as CPSF30-F2F3-FLAG were expressed by in vitro coupled transcription and translation of expression plasmids or empty vector in the presence of 35S labeled methionine and cysteine and expression was evaluated by autoradiography. Radiolabeled mutant or HK-wt NS1 proteins or empty vector were mixed with radiolabeled CPSF30-F2F3-FLAG and subject to pull-down using α-FLAG M2 antibody bound to Protein G Dynabeads then SDS-PAGE electrophoresis and autoradiography. (C) Representative pull-down of 3 independent replicates. (D) Pull-down SDS gels were subject to PhosphorScreen signal amplification, then band intensity quantification using GE Imagequant software. Data represent the means ± SD (*p<0.05, **p<0.01, *** p<0.001, ****p<0.0001; *****p<0.00001; two-tailed student's t-test) for relative NS1 binding.
Figure 6
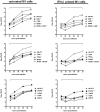
Figure 6. Mouse-adapted NS1 mutations enhance virus growth in untreated and in IFN-β primed mouse cells in vitro.
Mouse M1 cells were untreated (left panel) or pre-treated with mouse IFN-β (1000 U/mL) for 24 hours (right panel), then infected in triplicate at an MOI of 0.02 with rHK NS mutants or rHK-wt virus, and supernatant collected 12, 24, 48, and 72 hpi was quantified for viral titre by plaque assay on MDCK cells. Graphical analysis of data was broken into three mutant sets, with rHK-wt included in each, due to the number of mutants surveyed. Data represent the means ± SD (*p<0.05, **p<0.01, ***p<0.001; two-tailed student's paired t-test for 12–72 hpi, indicated by horizontal bracket above time range).
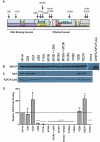
Figure 7
Figure 7. Mouse-adapted NS1 mutations enhance viral mRNA production in mouse cells in vitro.
Mouse M1 cells were infected in triplicate at an MOI of 2 with rHK NS mutants or rHK-wt virus, and total RNA isolated at 8 hpi was reverse transcribed using primers specific for viral mRNA. Real-time PCR (qPCR) was performed to quantify NP, M1 and NS1 viral mRNA levels. Results were normalized by β-actin levels, and presented as values relative to rHK-wt mRNA levels. Data represent the means ± SD (two-tailed student's paired t-test) for NP, NS1 and M1 mRNA relative levels (indicated by bracket) or two-tailed student's t-test for individual mRNA relative values (i p<0.05; ii p<0.01; iii p<0.001; iv p<0.0001; v p<0.00001).
Figure 8
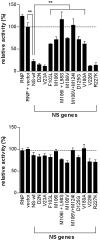
Figure 8. RNA polymerase mini-genome assay.
Viral RNA polymerase activity was measured in HEK 293-T cells expressing mutant or HK-wt NS genes as well as HK-wt PB2, PB1, PA, NP, and firefly luciferase driven by the NP promoter. (A) Relative polymerase activity was calculated as the ratio of firefly luciferase to renilla luciferase (under SV40 promoter control) luminescence and presented as means ± SD for three experiments (**p<0.01, student's t test). (B) NS mutants do not affect host gene expression. Renilla luciferace activity in cells transfected with HK RNP is not affected by NS mutant expression (p>0.05, student's t-test) compared to HK wt NS expression.
Figure 9
Figure 9. Mouse-adapted NS1 mutations enhance virus protein synthesis in untreated and IFN-β primed mouse cells in vitro.
M1 cells were left untreated or were pre-treated with 200 U/mL murine IFN-β for 24 hours, then infected with rHK NS MA or HK-wt virus at an MOI of 2. At 2, 4, 6, and 8 hpi the cells were pulsed with 35S for one hour then lysate was collected in SDS buffer. Autoradiography of collected samples are shown for (A) full time courses of HK-wt and rHK NS M106I + L98S and (B) 8 hour time points of all NS mutants. (+) and (−) symbols indicate whether cells were pre-treated with IFN-β. NP, M1 and NS1 protein positions are indicated, and were verified by western blot (data not shown). Data shown are representative of two independent experiments, which were each subject to densitometry analysis. Data represent the means ± SE (*p<0.05, **p<0.01, *** p<0.001; two-tailed student's t-test) for NS1 and M1 protein band density relative to rHK-wt in untreated cells (C) and in IFN-β primed cells (D).
Figure 10
Figure 10. NS1 mutants with altered M1∶ NS1 protein production ratio do not demonstrate altered viral protein half lives.
M1 cells were infected with specified rHK NS1 mutants or HK-wt virus at an MOI of 2. At 8 hpi the cells were pulsed with 35S for one hour. For pulse samples, the lysate was then collected in SDS buffer. For chase samples, the pulse medium was replaced with serum-free MEM then cell lysate was collected 1 or 3 hours later (n = 3). (A) Autoradiography of collected samples, indicating bands corresponding to M1 or NS1 protein, as verified by Western blot, (B) protein bands were quantified by PhosphorScreen signal amplification, then band intensity quantification using GE Imagequant software. Data represent the means ± SD of the ratio of M1 to NS1 protein levels. Statistical analysis was performed, however no virus induced a statistically significant (p<0.05, student's t test) difference in the ratio of M1∶NS1 from pulse to chase.
Figure 11
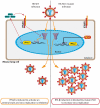
Figure 11. Model of adaptation of human HK-wt influenza virus to the mouse lung to enhance IFN-β antagonism.
Mouse adaptation involves the selection of NS1 mutants with enhanced IFN-β antagonism, so that upon infection of mouse lung cells in vivo the mutant NS1 gene reduces IFN-β gene (in yellow) activation in the nucleus and thus IFN-β protein (green) production and release. Therefore adaptive mutations prevent the IFN-β induction of an antiviral state that is mediated through binding of to the IFN-α/β receptor (IFNAR). This model proposes that reduced IFN-β production leads to a reduction in the antiviral state and greater virus yield.

References

    1. Guan Y, Peiris JS, Lipatov AS, Ellis TM, Dyrting KC, et al. Emergence of multiple genotypes of H5N1 avian influenza viruses in hong kong SAR. Proc Natl Acad Sci U S A. 2002;99(13):8950–8955. - PMC - PubMed
    1. Webster RG, Hulse-Post DJ, Sturm-Ramirez KM, Guan Y, Peiris M, et al. Changing epidemiology and ecology of highly pathogenic avian H5N1 influenza viruses. Avian Dis. 2007;51(1 Suppl):269–272. - PubMed
    1. World Health Organization. 2011. Cumulative number of confirmed human cases for avian influenza A(H5N1) reported to WHO, 2003–2011. 2011(17 October, 2011)
    1. Taubenberger JK, Kash JC. Influenza virus evolution, host adaptation, and pandemic formation. Cell Host Microbe. 2010;7(6):440–451. - PMC - PubMed
    1. Ping J, Keleta L, Forbes NE, Dankar S, Stecho W, et al. Genomic and protein structural maps of adaptive evolution of human influenza A virus to increased virulence in the mouse. PLoS One. 2011;6(6):e21740. - PMC - PubMed

Publication types

MeSH terms