

Variation in the glucose transporter gene SLC2A2 is associated with glycemic response to metformin
- PMID: 27500523
- PMCID: PMC5007158
- DOI: 10.1038/ng.3632
Variation in the glucose transporter gene SLC2A2 is associated with glycemic response to metformin
Abstract
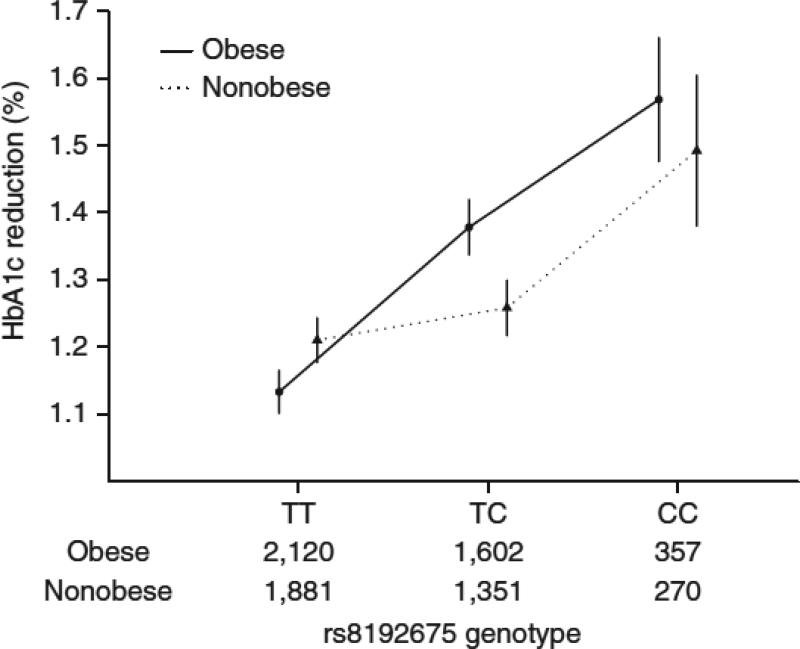
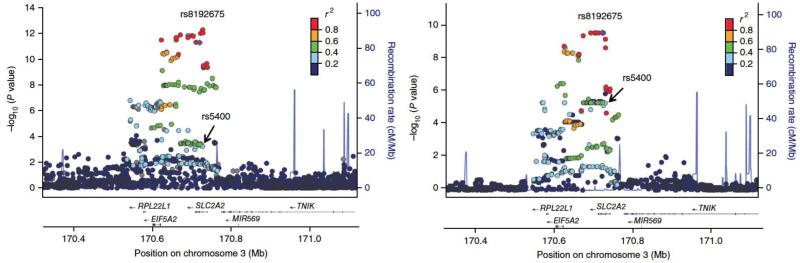
Metformin is the first-line antidiabetic drug with over 100 million users worldwide, yet its mechanism of action remains unclear. Here the Metformin Genetics (MetGen) Consortium reports a three-stage genome-wide association study (GWAS), consisting of 13,123 participants of different ancestries. The C allele of rs8192675 in the intron of SLC2A2, which encodes the facilitated glucose transporter GLUT2, was associated with a 0.17% (P = 6.6 × 10(-14)) greater metformin-induced reduction in hemoglobin A1c (HbA1c) in 10,577 participants of European ancestry. rs8192675 was the top cis expression quantitative trait locus (cis-eQTL) for SLC2A2 in 1,226 human liver samples, suggesting a key role for hepatic GLUT2 in regulation of metformin action. Among obese individuals, C-allele homozygotes at rs8192675 had a 0.33% (3.6 mmol/mol) greater absolute HbA1c reduction than T-allele homozygotes. This was about half the effect seen with the addition of a DPP-4 inhibitor, and equated to a dose difference of 550 mg of metformin, suggesting rs8192675 as a potential biomarker for stratified medicine.
Conflict of interest statement
The authors have declared that no competing interests exist.
Figures

Comment in
-
Diabetes: Genetic variation underpins metformin response.Nat Rev Endocrinol. 2016 Nov;12(11):626. doi: 10.1038/nrendo.2016.143. Epub 2016 Aug 26. Nat Rev Endocrinol. 2016. PMID: 27564711 No abstract available.
References
-
- DeFronzo RA, Goodman AM. Efficacy of metformin in patients with non-insulin-dependent diabetes mellitus. N. Engl. J. Med. 1995;333:541–549. - PubMed
-
- UK Prospective Diabetes Study (UKPDS) Group Effect of intensive blood-glucose control with metformin on complications in overweight patients with type 2 diabetes (UKPDS 34). Lancet. 1998;352:854–865. - PubMed
MeSH terms
Substances
Grants and funding
- U01 DK048412/DK/NIDDK NIH HHS/United States
- R01 HL110380/HL/NHLBI NIH HHS/United States
- U01 DK048413/DK/NIDDK NIH HHS/United States
- 084727/Z/08/Z/WT_/Wellcome Trust/United Kingdom
- 102820/Z/13/Z/WT_/Wellcome Trust/United Kingdom
- U01 DK048387/DK/NIDDK NIH HHS/United States
- U01 DK048404/DK/NIDDK NIH HHS/United States
- U01 DK048407/DK/NIDDK NIH HHS/United States
- 098381/WT_/Wellcome Trust/United Kingdom
- U01 DK048437/DK/NIDDK NIH HHS/United States
- U01 DK048406/DK/NIDDK NIH HHS/United States
- U01 DK085545/DK/NIDDK NIH HHS/United States
- U01 DK048375/DK/NIDDK NIH HHS/United States
- U01 DK048434/DK/NIDDK NIH HHS/United States
- R01 AI079139/AI/NIAID NIH HHS/United States
- 092272/WT_/Wellcome Trust/United Kingdom
- R01 HL118267/HL/NHLBI NIH HHS/United States
- R01 DK072041/DK/NIDDK NIH HHS/United States
- 085475/B/08/Z/WT_/Wellcome Trust/United Kingdom
- R01 DK078907/DK/NIDDK NIH HHS/United States
- 10/0004063/DUK_/Diabetes UK/United Kingdom
- 102820/WT_/Wellcome Trust/United Kingdom
- U01 DK048397/DK/NIDDK NIH HHS/United States
- U01 DK048381/DK/NIDDK NIH HHS/United States
- U01 DK048514/DK/NIDDK NIH HHS/United States
- U01 DK048485/DK/NIDDK NIH HHS/United States
- U01 DK048411/DK/NIDDK NIH HHS/United States
- U01 DK048443/DK/NIDDK NIH HHS/United States
- RC2 AG036607/AG/NIA NIH HHS/United States
- U01 DK048380/DK/NIDDK NIH HHS/United States
- U01 DK048400/DK/NIDDK NIH HHS/United States
- U19 GM061390/GM/NIGMS NIH HHS/United States
- 090532/WT_/Wellcome Trust/United Kingdom
- R01 GM117163/GM/NIGMS NIH HHS/United States
- U01 DK048468/DK/NIDDK NIH HHS/United States
- R01 DK064695/DK/NIDDK NIH HHS/United States
- U01 DK048489/DK/NIDDK NIH HHS/United States
- U01 DK048349/DK/NIDDK NIH HHS/United States
- 085475/Z/08/Z/WT_/Wellcome Trust/United Kingdom
- U01 DK048377/DK/NIDDK NIH HHS/United States
- P30 DK017047/DK/NIDDK NIH HHS/United States
LinkOut - more resources
Full Text Sources
Other Literature Sources
Medical
Molecular Biology Databases
Miscellaneous
