

Deciphering the ancient and complex evolutionary history of human arylamine N-acetyltransferase genes
- PMID: 16416399
- PMCID: PMC1380286
- DOI: 10.1086/500614
Deciphering the ancient and complex evolutionary history of human arylamine N-acetyltransferase genes
Abstract
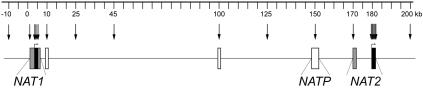
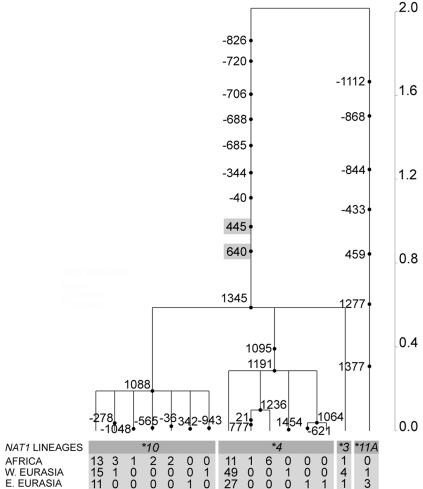
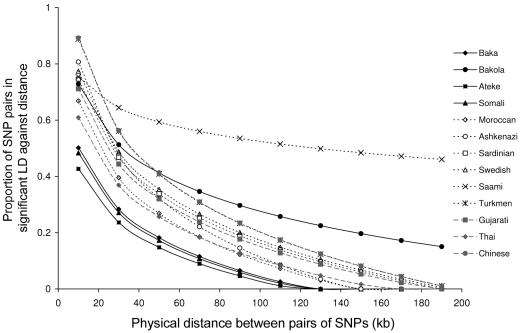
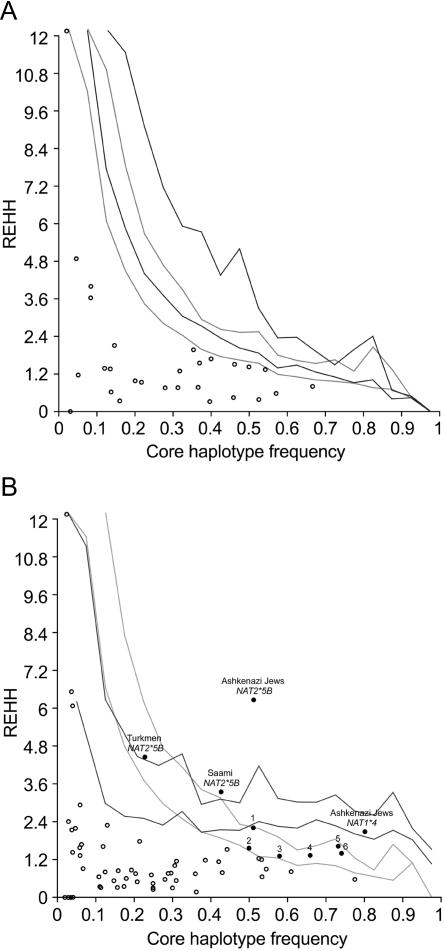
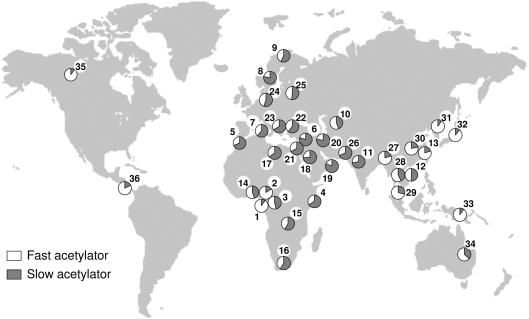
The human N-acetyltransferase genes NAT1 and NAT2 encode two phase-II enzymes that metabolize various drugs and carcinogens. Functional variability at these genes has been associated with adverse drug reactions and cancer susceptibility. Mutations in NAT2 leading to the so-called slow-acetylation phenotype reach high frequencies worldwide, which questions the significance of altered acetylation in human adaptation. To investigate the role of population history and natural selection in shaping NATs variation, we characterized genetic diversity through the resequencing and genotyping of NAT1, NAT2, and the pseudogene NATP in a collection of 13 different populations with distinct ethnic backgrounds and demographic pasts. This combined study design allowed us to define a detailed map of linkage disequilibrium of the NATs region as well as to perform a number of sequence-based neutrality tests and the long-range haplotype (LRH) test. Our data revealed distinctive patterns of variability for the two genes: the reduced diversity observed at NAT1 is consistent with the action of purifying selection, whereas NAT2 functional variation contributes to high levels of diversity. In addition, the LRH test identified a particular NAT2 haplotype (NAT2*5B) under recent positive selection in western/central Eurasians. This haplotype harbors the mutation 341T-->C and encodes the "slowest-acetylator" NAT2 enzyme, suggesting a general selective advantage for the slow-acetylator phenotype. Interestingly, the NAT2*5B haplotype, which seems to have conferred a selective advantage during the past approximately 6,500 years, exhibits today the strongest association with susceptibility to bladder cancer and adverse drug reactions. On the whole, the patterns observed for NAT2 well illustrate how geographically and temporally fluctuating xenobiotic environments may have influenced not only our genome variability but also our present-day susceptibility to disease.
Figures
References
Web Resources
-
- Arlequin v.2.001, http://lgb.unige.ch/arlequin/
-
- BEST v.1.0, http://genomethods.org/best/
-
- Bottleneck software, http://www.montpellier.inra.fr/CBGP/softwares/bottleneck/bottleneck.html
-
- DMLE+ v.2.2, http://www.dmle.org/
References
-
- Asprodini EK, Zifa E, Papageorgiou I, Benakis A (1998) Determination of N-acetylation phenotyping in a Greek population using caffeine as a metabolic probe. Eur J Drug Metab Pharmacokinet 23:501–506 - PubMed
-
- Behar DM, Hammer MF, Garrigan D, Villems R, Bonne-Tamir B, Richards M, Gurwitz D, Rosengarten D, Kaplan M, Pergola SD, Quintana-Murci L, Skorecki K (2004) MtDNA evidence for a genetic bottleneck in the early history of the Ashkenazi Jewish population. Eur J Hum Genet 12:355–36410.1038/sj.ejhg.5201156 - DOI - PubMed
Publication types
MeSH terms
Substances
Associated data
- Actions
- Actions
- Actions
- Actions
- Actions
- Actions
- Actions
- Actions
- Actions
- Actions
- Actions
- Actions
- Actions
- Actions
- Actions
- Actions
- Actions
- Actions
- Actions
- Actions
- Actions
- Actions
- Actions
- Actions
- Actions
- Actions
- Actions
- Actions
- Actions
- Actions
- Actions
- Actions
- Actions
- Actions
- Actions
- Actions
- Actions
- Actions
- Actions
- Actions
- Actions
- Actions
- Actions
- Actions
- Actions
- Actions
- Actions
- Actions
- Actions
- Actions
- Actions
- Actions
- Actions
- Actions
- Actions
- Actions
- Actions
- Actions
- Actions
- Actions
- Actions
- Actions
- Actions
- Actions
- Actions
- Actions
- Actions
- Actions
- Actions
- Actions
- Actions
- Actions
- Actions
- Actions
- Actions
- Actions
- Actions
- Actions
- Actions
- Actions
- Actions
- Actions
- Actions
- Actions
- Actions
- Actions
- Actions
- Actions
- Actions
- Actions
- Actions
- Actions
- Actions
- Actions
- Actions
- Actions
- Actions
- Actions
- Actions
- Actions
- Actions
- Actions
- Actions
- Actions
- Actions
- Actions
- Actions
- Actions
- Actions
- Actions
- Actions
- Actions
- Actions
- Actions
- Actions
- Actions
- Actions
- Actions
- Actions
- Actions
- Actions
- Actions
- Actions
- Actions
- Actions
- Actions
- Actions
- Actions
- Actions
- Actions
- Actions
- Actions
- Actions
- Actions
- Actions
- Actions
- Actions
- Actions
- Actions
- Actions
- Actions
- Actions
- Actions
- Actions
- Actions
- Actions
- Actions
- Actions
- Actions
- Actions
- Actions
- Actions
- Actions
- Actions
- Actions
- Actions
- Actions
- Actions
- Actions
- Actions
- Actions
- Actions
- Actions
- Actions
- Actions
- Actions
- Actions
- Actions
- Actions
- Actions
- Actions
- Actions
- Actions
- Actions
- Actions
- Actions
- Actions
- Actions
- Actions
- Actions
- Actions
- Actions
- Actions
- Actions
- Actions
- Actions
- Actions
- Actions
- Actions
- Actions
- Actions
- Actions
- Actions
- Actions
- Actions
- Actions
- Actions
- Actions
- Actions
- Actions
- Actions
- Actions
- Actions
- Actions
- Actions
- Actions
- Actions
- Actions
- Actions
- Actions
- Actions
- Actions
- Actions
- Actions
- Actions
- Actions
- Actions
- Actions
- Actions
- Actions
- Actions
- Actions
- Actions
- Actions
- Actions
- Actions
- Actions
- Actions
- Actions
- Actions
- Actions
- Actions
- Actions
- Actions
- Actions
- Actions
- Actions
- Actions
- Actions
- Actions
- Actions
- Actions
- Actions
- Actions
- Actions
- Actions
- Actions
- Actions
- Actions
- Actions
- Actions
- Actions
- Actions
- Actions
- Actions
- Actions
- Actions
- Actions
- Actions
- Actions
- Actions
- Actions
- Actions
- Actions
- Actions
- Actions
- Actions
- Actions
- Actions
- Actions
- Actions
- Actions
- Actions
- Actions
- Actions
- Actions
- Actions
- Actions
- Actions
- Actions
- Actions
- Actions
- Actions
- Actions
- Actions
- Actions
- Actions
- Actions
- Actions
- Actions
- Actions
- Actions
- Actions
- Actions
- Actions
- Actions
- Actions
- Actions
- Actions
- Actions
- Actions
- Actions
- Actions
- Actions
- Actions
- Actions
- Actions
- Actions
- Actions
- Actions
- Actions
- Actions
- Actions
- Actions
- Actions
- Actions
- Actions
- Actions
- Actions
- Actions
- Actions
- Actions
- Actions
- Actions
- Actions
- Actions
- Actions
- Actions
- Actions
- Actions
- Actions
- Actions
- Actions
- Actions
- Actions
- Actions
- Actions
- Actions
- Actions
- Actions
- Actions
- Actions
- Actions
- Actions
- Actions
- Actions
- Actions
- Actions
- Actions
- Actions
- Actions
- Actions
- Actions
- Actions
- Actions
- Actions
- Actions
- Actions
- Actions
- Actions
- Actions
- Actions
- Actions
- Actions
- Actions
- Actions
- Actions
- Actions
- Actions
- Actions
- Actions
- Actions
- Actions
- Actions
- Actions
- Actions
- Actions
- Actions
- Actions
- Actions
- Actions
- Actions
- Actions
- Actions
- Actions
- Actions
- Actions
- Actions
- Actions
- Actions
- Actions
- Actions
- Actions
- Actions
- Actions
- Actions
- Actions
- Actions
- Actions
- Actions
- Actions
- Actions
- Actions
- Actions
- Actions
- Actions
- Actions
- Actions
- Actions
- Actions
- Actions
- Actions
- Actions
- Actions
- Actions
- Actions
- Actions
- Actions
- Actions
- Actions
- Actions
- Actions
- Actions
- Actions
- Actions
- Actions
- Actions
- Actions
- Actions
- Actions
- Actions
- Actions
- Actions
- Actions
- Actions
- Actions
- Actions
- Actions
- Actions
- Actions
- Actions
- Actions
- Actions
- Actions
- Actions
- Actions
- Actions
- Actions
- Actions
- Actions
- Actions
- Actions
- Actions
- Actions
- Actions
- Actions
- Actions
- Actions
- Actions
- Actions
- Actions
- Actions
- Actions
- Actions
- Actions
- Actions
- Actions
- Actions
- Actions
- Actions
- Actions
- Actions
- Actions
- Actions
- Actions
- Actions
- Actions
- Actions
- Actions
- Actions
LinkOut - more resources
Full Text Sources
Other Literature Sources
Molecular Biology Databases
Miscellaneous
