Comparative Study
. 2010 Mar 19;397(1):119-43.
doi: 10.1016/j.jmb.2010.01.011. Epub 2010 Jan 11.

Comparative genomic analysis of 60 Mycobacteriophage genomes: genome clustering, gene acquisition, and gene size

Affiliations
Comparative Study

Comparative genomic analysis of 60 Mycobacteriophage genomes: genome clustering, gene acquisition, and gene size

Graham F Hatfull et al. J Mol Biol. .

Abstract

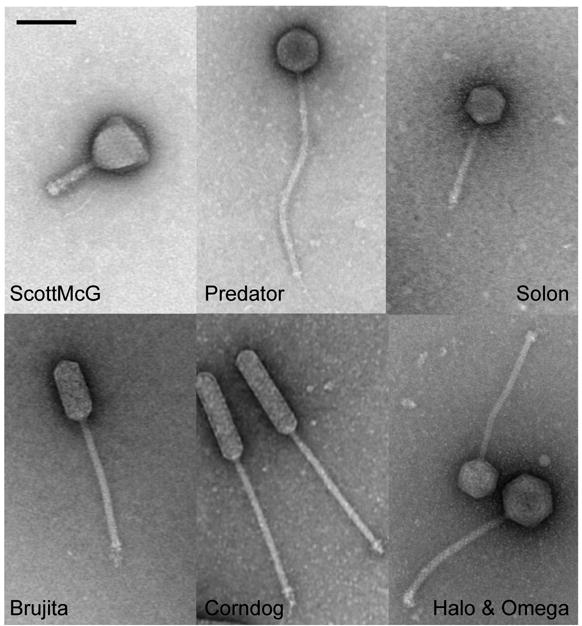
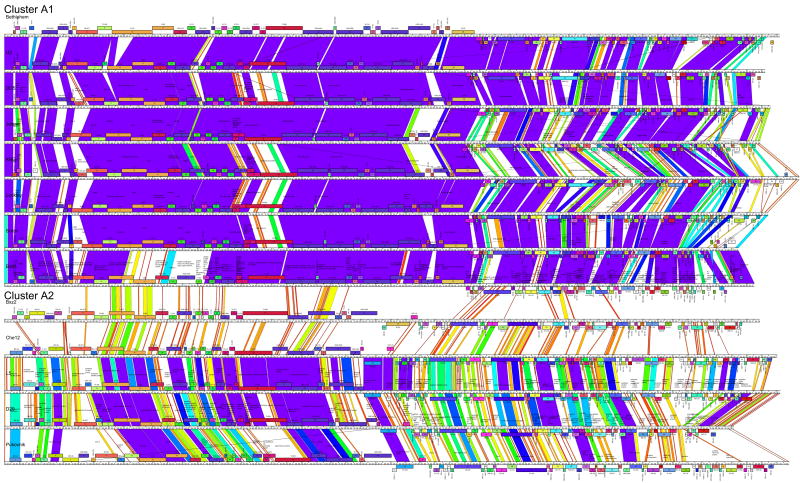
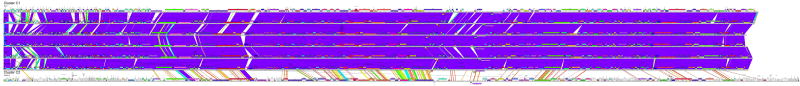
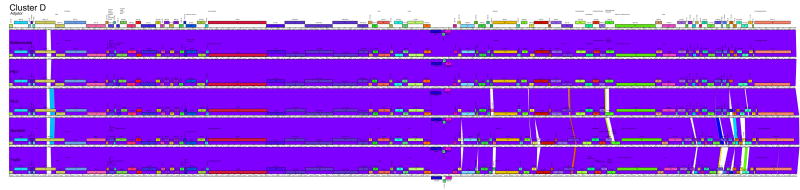
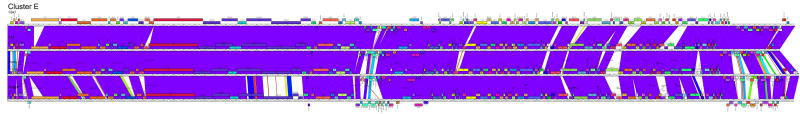
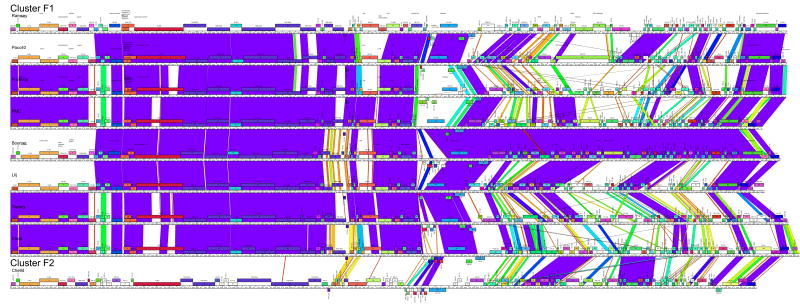
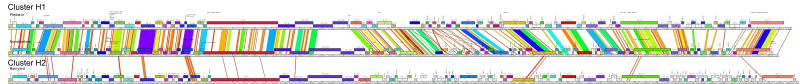
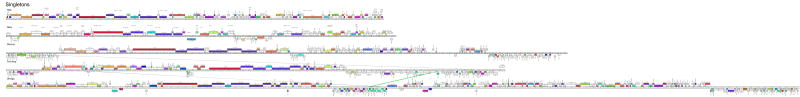
Mycobacteriophages are viruses that infect mycobacterial hosts. Expansion of a collection of sequenced phage genomes to a total of 60-all infecting a common bacterial host-provides further insight into their diversity and evolution. Of the 60 phage genomes, 55 can be grouped into nine clusters according to their nucleotide sequence similarities, 5 of which can be further divided into subclusters; 5 genomes do not cluster with other phages. The sequence diversity between genomes within a cluster varies greatly; for example, the 6 genomes in Cluster D share more than 97.5% average nucleotide similarity with one another. In contrast, similarity between the 2 genomes in Cluster I is barely detectable by diagonal plot analysis. In total, 6858 predicted open-reading frames have been grouped into 1523 phamilies (phams) of related sequences, 46% of which possess only a single member. Only 18.8% of the phams have sequence similarity to non-mycobacteriophage database entries, and fewer than 10% of all phams can be assigned functions based on database searching or synteny. Genome clustering facilitates the identification of genes that are in greatest genetic flux and are more likely to have been exchanged horizontally in relatively recent evolutionary time. Although mycobacteriophage genes exhibit a smaller average size than genes of their host (205 residues compared with 315), phage genes in higher flux average only 100 amino acids, suggesting that the primary units of genetic exchange correspond to single protein domains.


Figures

Figure 1
Figure 1. Mycobacteriophage morphotypes
Representatives of each of the different mycobacteriophage morphotypes are shown. Of the 60 sequenced phages, seven phages exhibit myoviral morphotypes with isometric heads (e.g. ScottMcG), and the other 53 all have siphoviral morphotypes. Three of the siphoviruses contain prolate heads, ranging from a length:width ratio of ∼2.5:1 (e.g. Brujita) to 4:1 (Corndog). Tail lengths also vary by greater than two-fold, from the Cluster A phages (e.g. Solon, tail shaft average 113nm) to the Cluster H phages (e.g. Predator, tail shaft average 293nm). Bar corresponds to 100nm. Morphotypes of all 60 phages are shown in Fig. S2 and virion dimensions are listed in Table S1.
Figure 2
Figure 2. Nucleotide sequence comparisons of mycobacteriophage genomes
A. Dotplot of all 60 sequenced mycobacteriophage genomes displayed using Gepard. Individual genome sequences were concatenated into a single sequence arranged such that related genomes were adjacent to each other. The assignment of Clusters and Subclusters are shown at the top. B. Dotplot of Omega and Tweety showing a segment of ∼6.5kbp that is very similar. Omega and Tweety have not been grouped in the same Cluster, because the similarity does not span >50% of the genomes. C. Dotplot analysis of Cluster H genomes. Predator and Konstantine are more closely related to each other than to Barnyard or other phages and constitute subcluster H1. Barnyard (subcluster H 2) is included within the H cluster because its similarity to other cluster H spans more than 50% of the genome even though its relationship to Konstantine and Predator is weak. D. Dotplot of Konstantine (subcluster H 1) and PBI1 (Cluster D) showing a weak relationship that does not warrant inclusion in the same cluster.
Figure 3
Figure 3. Splitstree representation of mycobacteriophage relationships
All 6,858 mycobacteriophage predicted protein products were assorted into 1,523 phamilies according to shared sequence similarities. Each genome was then assigned a value reflecting the presence or absence of a pham member, and the genomes compared and displayed using Splitstree. The clusters and subclusters derived from dotplot analyses are annotated. The scale bar indicates 0.01 substitutions/site.
Figure 4
Figure 4. Pairwise alignment of clustered mycobacteriophages genomes
Each of the mycobacteriophage genome clusters are displayed showing segments of nucleotide sequence similarity between adjacently displayed genomes. The strength of the relationship is represented by shading according to the color spectrum, with purple being the highest. The order of the genomes displayed within each subcluster is as follows: A1: Bethlehem, U2, DD5, Jasper, KBG, Lockley, Solon, Bxb1; A2: Bxz2, Che12, L5, D29, Pukovnik; B1: Chah, Orion, PG1; B2: Rosebush, Qyrzula; B3, Phaedrus, Pipefish; B4: Nigel, Cooper; C1: Bxz1, Cali, Catera, Rizal, Spud, ScottMcG; C2: Myrna; D: Adjutor, Butterscotch, PBI1, Plot, Gumball, Troll4; E: Cjw1, 244, Porky, Kostya; F1: Ramsey, Pacc40, Fruitloop, PMC, Boomer, Llij, Tweety, Che8; F2: Che9d; G: BPs, Halo; H1: Predator, Konstantine; H2: Barnyard; I: Che9c, Brujita; Singletons: TM4, Giles, Wildcat, Corndog, Omega. Detailed maps of individual genomes are shown in Fig. S1.
Figure 5
Figure 5. Cluster diversity and inter-cluster relationships
A. Distribution of cluster-universal, cluster-unique, and cluster-identifier phams. Cluster-universal phams (blue bars) are defined as those that are present within all genome members within a cluster or subcluster (as shown below the x-axis with the numbers of genomes), and their proportion of the total number of phams in that cluster or subcluster is shown as a percentage. Cluster-unique phams (red bars) are defined as those that are present within that cluster or subcluster and are not present in other mycobacteriophages, and their proportion of the total number of phams in that cluster or subcluster is shown as a percentage. Cluster -identifier phams (yellow bars) are defined as those that are found in all genomes within a cluster or subcluster, but absent from all other mycobacteriophages. B. Some phams are present in only one genome within a cluster/subcluster, and these are candidates for being acquired relatively recently by horizontal genetic exchange. A subset of these has one or more relatives in other cluster/subcluster genomes as illustrated for the four subclusters (A1, A2, C1 and F1) that contain at least five genome members (see Table 2). Along the x-axis each of the phams (grouped by the subcluster containing just the single member) is shown, with bars above indicating which other genomes contain homologues and to which cluster they belong. The sixty genomes are listed vertically and arranged into clusters as shown on the right. The locations of the relatives of these putative newly acquired genes are distributed among the mycobacteriophages genomes suggesting that they have been acquired from multiple sources and not from any single prominent genome cluster. It is noteworthy that no relatives are seen in Cluster G, and Cluster D only has relatives for the Pham992 member present in one A2 cluster member (D29). Gene members of each Pham and their specific genome and cluster locations are listed in Table S2. C. Average protein size of phams distributed in different numbers of genomes within clusters/subclusters A1, A2, C1, D and F1. For each pham, the average protein length (in amino acid residues) is plotted as a function of how many genomes the pham is present in. The total number of genomes within each cluster/subcluster is shown in parentheses. The average length of all mycobacteriophage predicted proteins is shown by the horizontal bar. Note that phams present in only a subset of the cluster genomes are substantially smaller, with the exception of one category in Cluster F1. However, there is only a single gene member in this category.
Figure 6
Figure 6. Phylogenetic relationships of mycobacteriophage terminases
The protein sequences of all members of Phams 2, 394, and 891 were aligned using ClustalX and the tree represented by Njplot. The members of Phams 2, 394 and 891 are shown in red, green and blue boxes respectively. Cluster designations of individual genomes are shown on the right; singleton phages are notated as Sin. Phage genes corresponding to genomes with defined cohesive termini are shown in bold type and those with terminally redu ndant ends are shown in italic type. Note that the Cluster C phages are only included in Pham 2 because of the presence of an intein that is related to inteins in other Pham 2 members. Bootstrap values are derived from 1000 iterations. Scale bar represents the estimated number of changes per site.

Similar articles

Cited by

References

    1. Hendrix RW. Bacteriophages: evolution of the majority. Theor Popul Biol. 2002;61:471–80. - PubMed
    1. Pedulla ML, Ford ME, Houtz JM, Karthikeyan T, Wadsworth C, Lewis JA, Jacobs-Sera D, Falbo J, Gross J, Pannunzio NR, Brucker W, Kumar V, Kandasamy J, Keenan L, Bardarov S, Kriakov J, Lawrence JG, Jacobs WR, Hendrix RW, Hatfull GF. Origins of highly mosaic mycobacteriophage genomes. Cell. 2003;113:171–82. - PubMed
    1. Brussow H, Hendrix RW. Phage genomics: small is beautiful. Cell. 2002;108:13–6. - PubMed
    1. Hendrix RW. Bacteriophage genomics. Curr Opin Microbiol. 2003;6:506–11. - PubMed
    1. Hatfull GF. Bacteriophage genomics. Curr Opin Microbiol. 2008;11:447–53. - PMC - PubMed

Publication types

Associated data

LinkOut - more resources