. 2016 Apr;13(4):310-8.
doi: 10.1038/nmeth.3773. Epub 2016 Feb 22.

Inferring causal molecular networks: empirical assessment through a community-based effort

Collaborators, Affiliations

Inferring causal molecular networks: empirical assessment through a community-based effort

Steven M Hill et al. Nat Methods. 2016 Apr.

Abstract

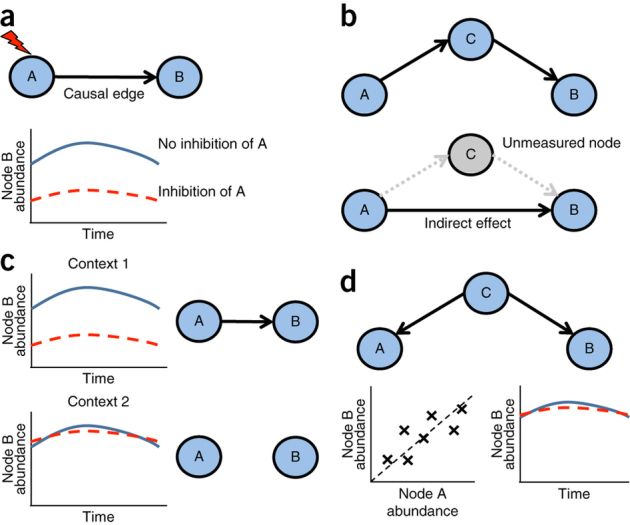
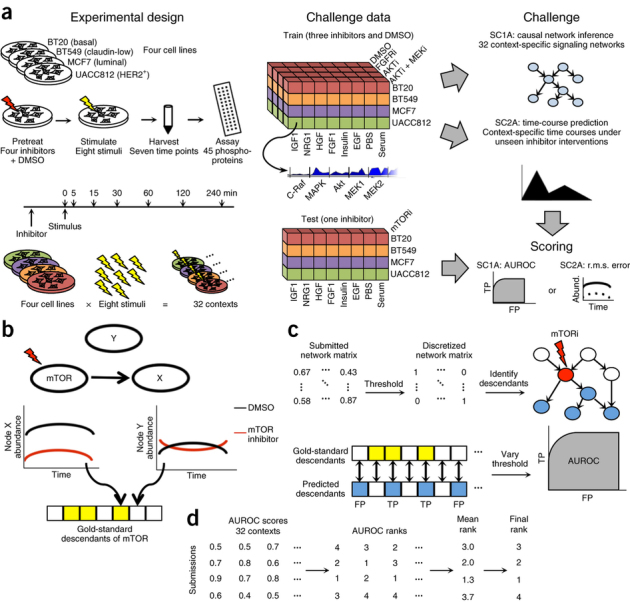
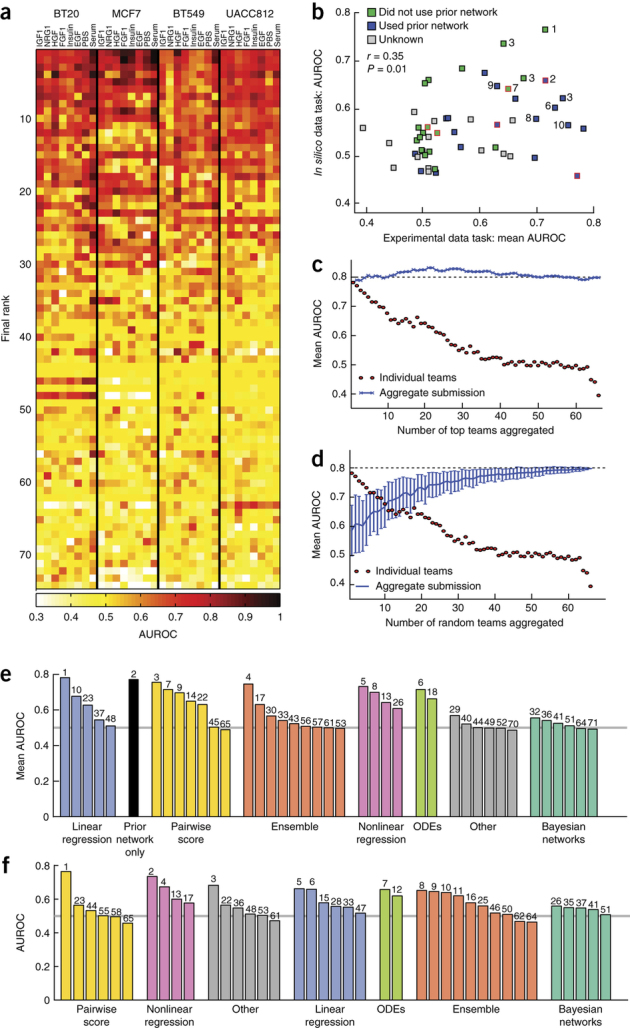
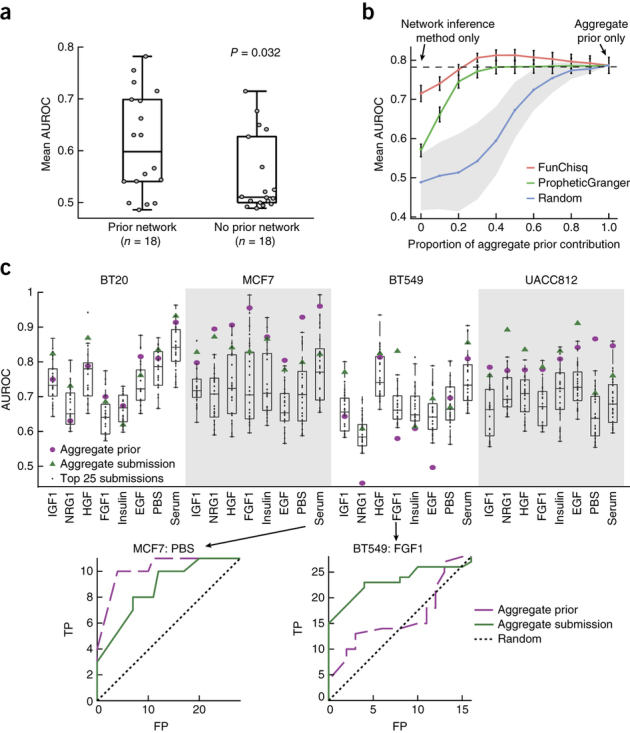
It remains unclear whether causal, rather than merely correlational, relationships in molecular networks can be inferred in complex biological settings. Here we describe the HPN-DREAM network inference challenge, which focused on learning causal influences in signaling networks. We used phosphoprotein data from cancer cell lines as well as in silico data from a nonlinear dynamical model. Using the phosphoprotein data, we scored more than 2,000 networks submitted by challenge participants. The networks spanned 32 biological contexts and were scored in terms of causal validity with respect to unseen interventional data. A number of approaches were effective, and incorporating known biology was generally advantageous. Additional sub-challenges considered time-course prediction and visualization. Our results suggest that learning causal relationships may be feasible in complex settings such as disease states. Furthermore, our scoring approach provides a practical way to empirically assess inferred molecular networks in a causal sense.


Conflict of interest statement

The authors declare no competing financial interests.

Figures

Figure 1
Figure 1. Causal networks.
(a) A directed edge denotes that inhibition of the parent node A can change the abundance of the child node B. (b) Causal edges, as used here, may represent direct effects or indirect effects that occur via unmeasured intermediate nodes. If node A causally influences node B via measured node C, the causal network should contain edges from A to C and from C to B, but not from A to B (top). However, if node C is not measured (and is not part of the network), the causal network should contain an edge from A to B (bottom). Note that in both cases inhibition of node A will lead to a change in node B. (c) Causal edges may depend on biological context; for example, a causal edge from A to B appears in context 1, but not in context 2 (lines in graphs are as defined in a). (d) Correlation and causation. Nodes A and B are correlated owing to regulation by the same node (C), but in this example no sequence of mechanistic events links A to B, and thus inhibition of A does not change the abundance of B (lines in bottom right graph are as defined in a). Therefore, despite the correlation, there is no causal edge from A to B.
Figure 2
Figure 2. The HPN-DREAM network inference challenge: overview of experimental data tasks and causal assessment strategy.
(a) Protein data were obtained from four cancer cell lines under eight stimuli (described in ref. 31). For each of the 32 resulting contexts, participants were provided with training data comprising time courses for ∼45 phosphoproteins under three different kinase inhibitors and a control (DMSO). For the sub-challenge 1 experimental data task (SC1A), participants were asked to infer causal signaling networks specific to each context. In SC2A, the aim was to predict context-specific phosphoprotein time courses. In both cases, submissions were assessed using held-out, context-specific test data that were obtained under an unseen intervention (inhibition of the kinase mTOR). Each sub-challenge also included a companion in silico data task (SC1B and SC2B, respectively; described in the text, Online Methods and Supplementary Fig. 1). Abund., abundance; TP, true positives; FP, false positives. (b) Networks submitted for SC1A were assessed causally in terms of agreement with the interventional test data. For each context, the set of nodes that changed under mTOR inhibition was identified (gold-standard causal descendants of mTOR; described in the text and Online Methods). In the example shown, node X is a descendant of mTOR, whereas node Y is not. (c) Predicted descendants of mTOR from submitted context-specific networks were compared with their experimentally determined gold-standard counterparts. This gave true and false positive counts and a (context-specific) AUROC. (d) In each context, teams were ranked by AUROC score, and mean rank across contexts gave the final rankings.
Figure 3
Figure 3. Network inference sub-challenge (SC1) results.
(a) AUROC scores in each of the 32 (cell line, stimulus) contexts for the 74 teams that submitted networks for the experimental data task. (b) Scores in experimental and in silico data tasks. Each square represents a team. Red borders around squares indicate that a different method was used in each task. Numbers adjacent to squares indicate ranks for the top ten teams under a combined score (three teams ranked third). (c,d) Results of crowdsourcing for the experimental data task. Aggregate networks were formed by combining, for each context, networks from top scoring (c) or randomly selected (d) teams (Online Methods). Dashed lines indicate aggregations of all submissions. Results in d are mean values over 100 iterations of random selection (error bars indicate ±s.d.). (e,f) Performance by method type for the experimental (e) and in silico (f) data tasks. The final rank is shown above each bar, and the gray lines indicate the mean performance of random predictions. ODE, ordinary differential equation.
Figure 4
Figure 4. Role of pre-existing biological knowledge in the experimental data network inference task (SC1A).
(a) Box plots showing mean AUROC scores for teams that either did or did not use a prior network. P value calculated via Wilcoxon rank-sum test (n = 18). (b) Performance of aggregate prior network when combined with networks inferred by PropheticGranger (top performer in SC1A when combined with a network prior) or FunChisq (top performer in SC1B). The blue line indicates aggregate prior combined with randomly generated networks (mean of 30 random networks; shading indicates ±s.d.). The dashed line shows the mean AUROC score achieved by the top-performing team in SC1A. Error bars denote ±s.e.m. (c) Performance of aggregate submission network and aggregate prior network in each context. Top, performance by context. Box plots over AUROC scores for the top 25 performers for each context, shown for comparison. Bottom, receiver operating characteristic curves for two contexts that showed performance differences between aggregate submission and prior. For all box plots, line within the box indicates the median, and the box edges denote the 25th and 75th percentiles. Whiskers extend to 1.5 times the interquartile range from the box hinge. Individual data points are also shown.
Figure 5
Figure 5. Aggregate submission networks for the experimental data network inference task (SC1A).
(a) The aggregate submission network for cell line MCF7 under HGF stimulation. Line thickness corresponds to edge weight (number of edges shown set to equal number of nodes). To determine which edges were present and not present in the aggregate prior network, we placed a threshold of 0.1 on edge weights. Green and blue nodes represent descendants of mTOR in the network shown (Fig. 2b,c and Supplementary Fig. 2). The network was generated using Cytoscape. (b) Principal component analysis applied to edge scores for the 32 context-specific aggregate submission networks (Online Methods).

References

    1. Bansal M, Belcastro V, Ambesi-Impiombato A, di Bernardo D. How to infer gene networks from expression profiles. Mol. Syst. Biol. 2007;3:78. doi: 10.1038/msb4100120. - DOI - PMC - PubMed
    1. Markowetz F, Spang R. Inferring cellular networks—a review. BMC Bioinformatics. 2007;8:S5. doi: 10.1186/1471-2105-8-S6-S5. - DOI - PMC - PubMed
    1. Hecker M, Lambeck S, Toepfer S, van Someren E, Guthke R. Gene regulatory network inference: data integration in dynamic models—a review. Biosystems. 2009;96:86–103. doi: 10.1016/j.biosystems.2008.12.004. - DOI - PubMed
    1. De Smet R, Marchal K. Advantages and limitations of current network inference methods. Nat. Rev. Microbiol. 2010;8:717–729. doi: 10.1038/nrmicro2419. - DOI - PubMed
    1. Marbach D, et al. Revealing strengths and weaknesses of methods for gene network inference. Proc. Natl. Acad. Sci. USA. 2010;107:6286–6291. doi: 10.1073/pnas.0913357107. - DOI - PMC - PubMed

Publication types