. 2017 Jan 12;541(7636):169-175.
doi: 10.1038/nature20805. Epub 2017 Jan 4.

Integrated genomic characterization of oesophageal carcinoma

Cancer Genome Atlas Research NetworkAnalysis Working Group: Asan UniversityBC Cancer AgencyBrigham and Women’s HospitalBroad InstituteBrown UniversityCase Western Reserve UniversityDana-Farber Cancer InstituteDuke UniversityGreater Poland Cancer CentreHarvard Medical SchoolInstitute for Systems BiologyKU LeuvenMayo ClinicMemorial Sloan Kettering Cancer CenterNational Cancer InstituteNationwide Children’s HospitalStanford UniversityUniversity of AlabamaUniversity of MichiganUniversity of North CarolinaUniversity of PittsburghUniversity of RochesterUniversity of Southern CaliforniaUniversity of Texas MD Anderson Cancer CenterUniversity of WashingtonVan Andel Research InstituteVanderbilt UniversityWashington UniversityGenome Sequencing Center: Broad InstituteWashington University in St. LouisGenome Characterization Centers: BC Cancer AgencyBroad InstituteHarvard Medical SchoolSidney Kimmel Comprehensive Cancer Center at Johns Hopkins UniversityUniversity of North CarolinaUniversity of Southern California Epigenome CenterUniversity of Texas MD Anderson Cancer CenterVan Andel Research InstituteGenome Data Analysis Centers: Broad InstituteBrown University:Harvard Medical SchoolInstitute for Systems BiologyMemorial Sloan Kettering Cancer CenterUniversity of California Santa CruzUniversity of Texas MD Anderson Cancer CenterBiospecimen Core Resource: International Genomics ConsortiumResearch Institute at Nationwide Children’s HospitalTissue Source Sites: Analytic Biologic ServicesAsan Medical CenterAsterand BioscienceBarretos Cancer HospitalBioreclamationIVTBotkin Municipal ClinicChonnam National University Medical SchoolChristiana Care Health SystemCurelineDuke UniversityEmory UniversityErasmus UniversityIndiana University School of MedicineInstitute of Oncology of MoldovaInternational Genomics ConsortiumInvidumedIsraelitisches Krankenhaus HamburgKeimyung University School of MedicineMemorial Sloan Kettering Cancer CenterNational Cancer Center GoyangOntario Tumour BankPeter MacCallum Cancer CentrePusan National University Medical SchoolRibeirão Preto Medical SchoolSt. Joseph’s Hospital &Medical CenterSt. Petersburg Academic UniversityTayside Tissue BankUniversity of DundeeUniversity of Kansas Medical CenterUniversity of MichiganUniversity of North Carolina at Chapel HillUniversity of Pittsburgh School of MedicineUniversity of Texas MD Anderson Cancer CenterDisease Working Group: Duke UniversityMemorial Sloan Kettering Cancer CenterNational Cancer InstituteUniversity of Texas MD Anderson Cancer CenterYonsei University College of MedicineData Coordination Center: CSRA Inc.Project Team: National Institutes of Health
Collaborators

Integrated genomic characterization of oesophageal carcinoma

Cancer Genome Atlas Research Network et al. Nature. .

Abstract

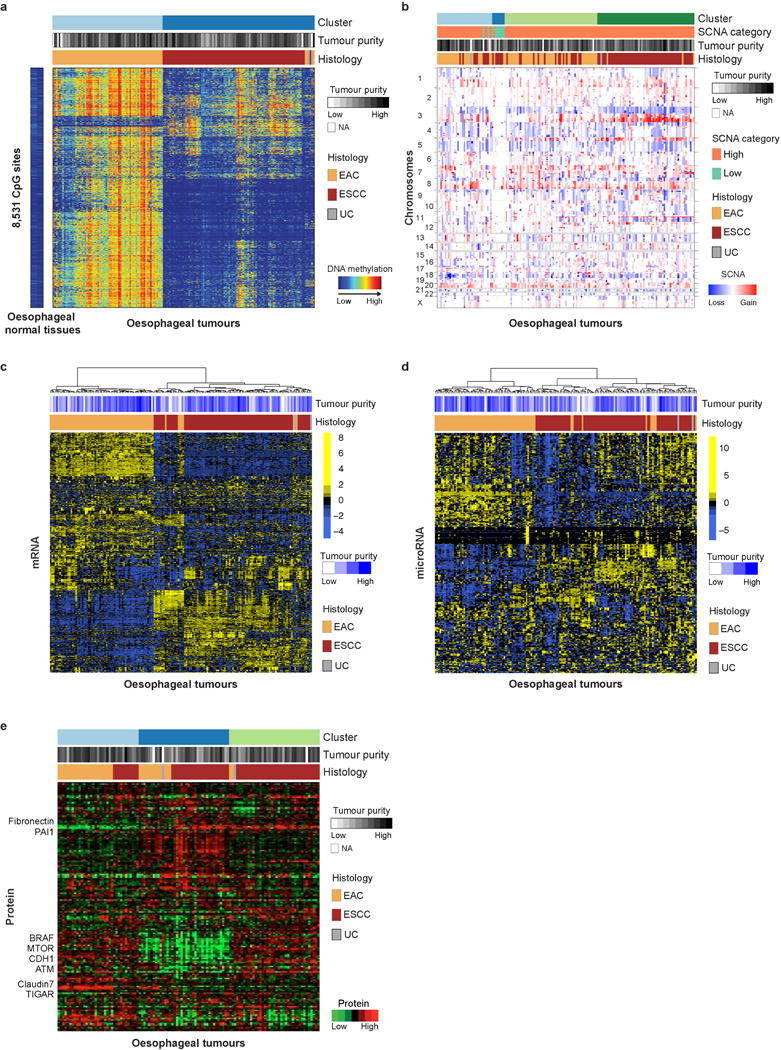
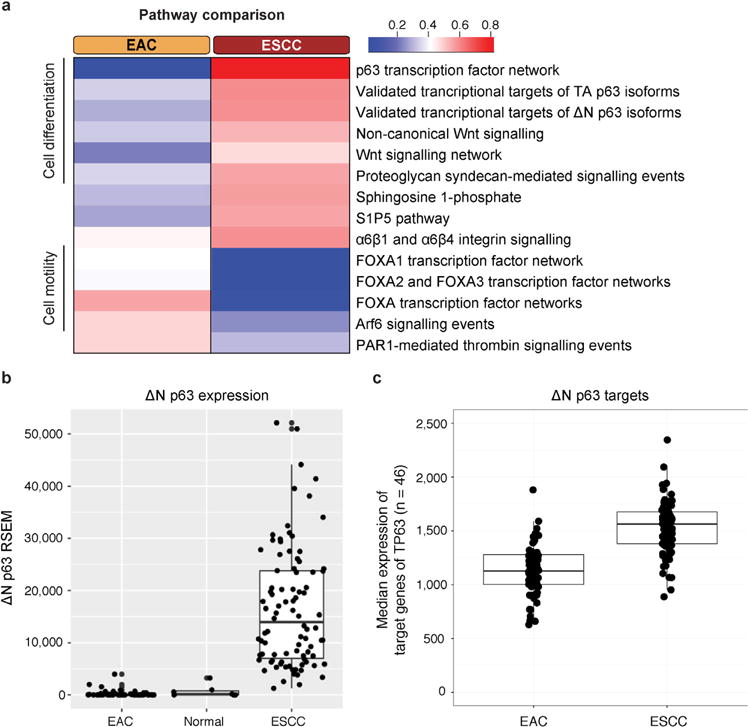
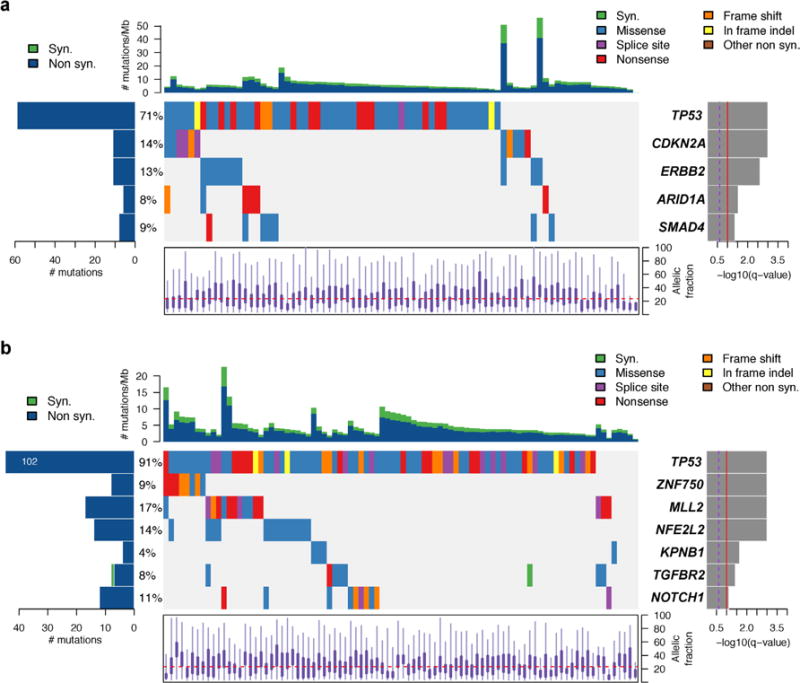
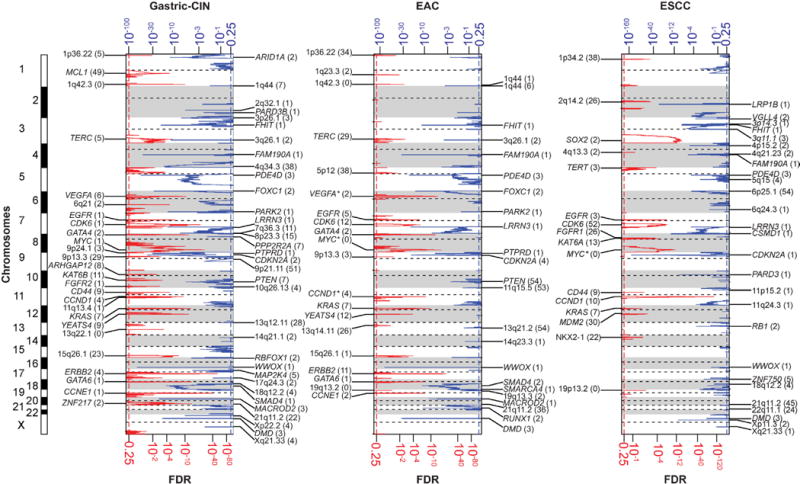
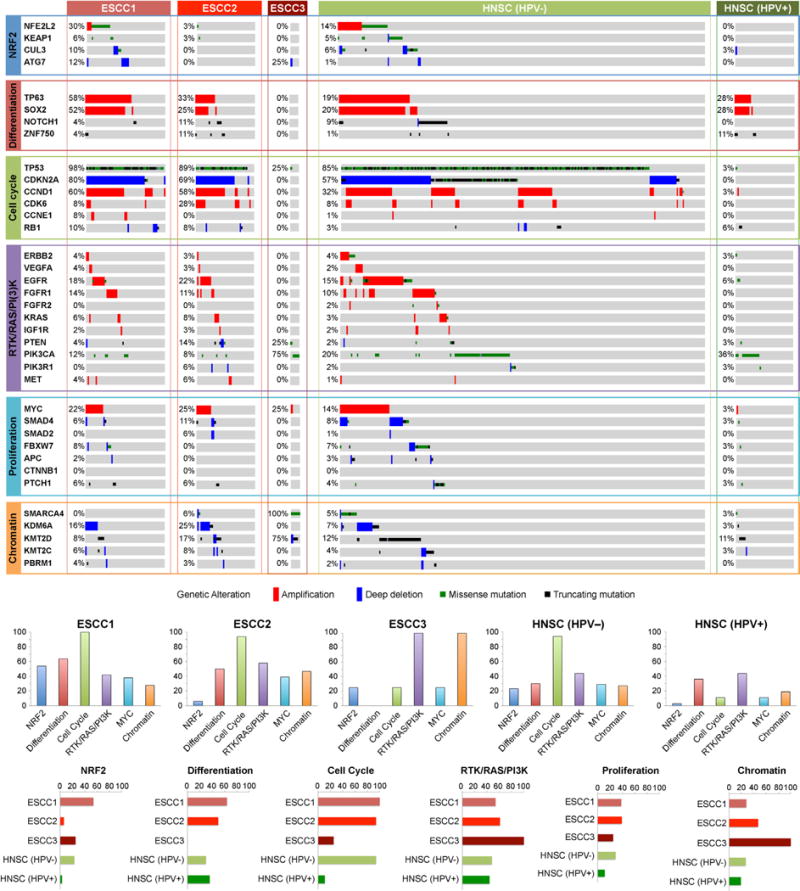
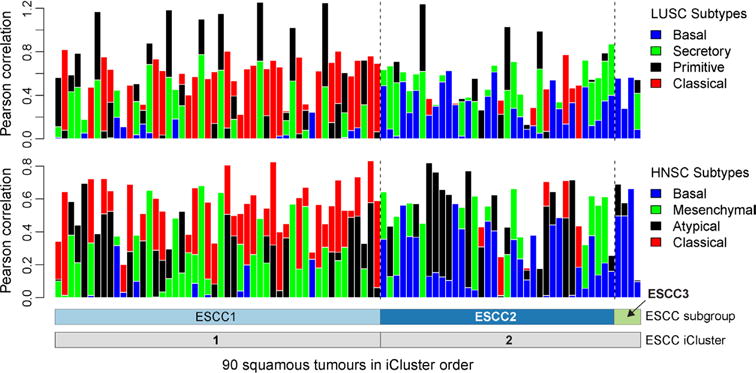
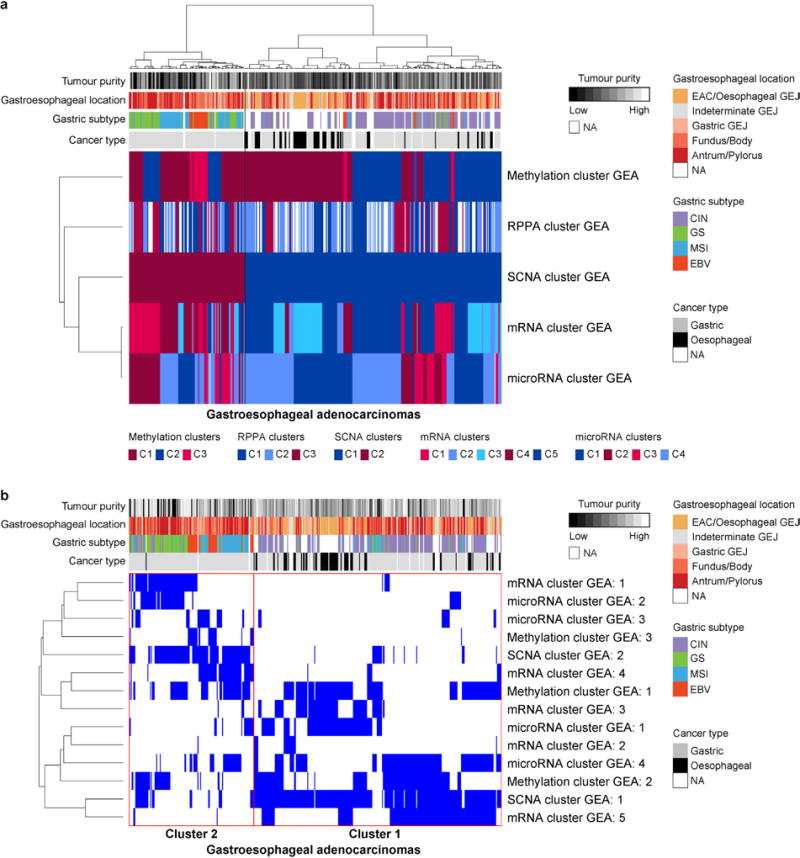
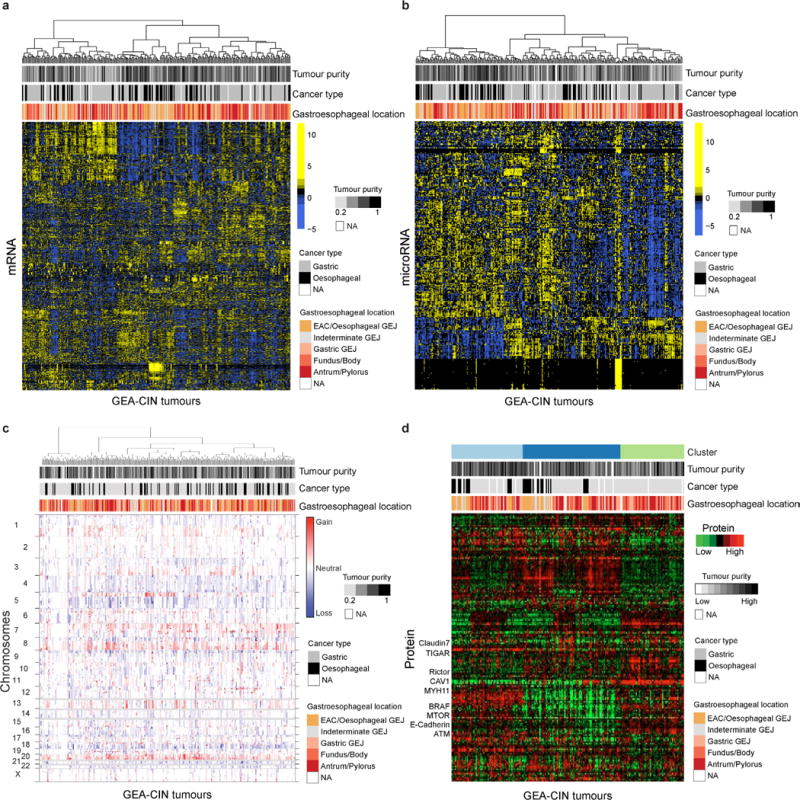
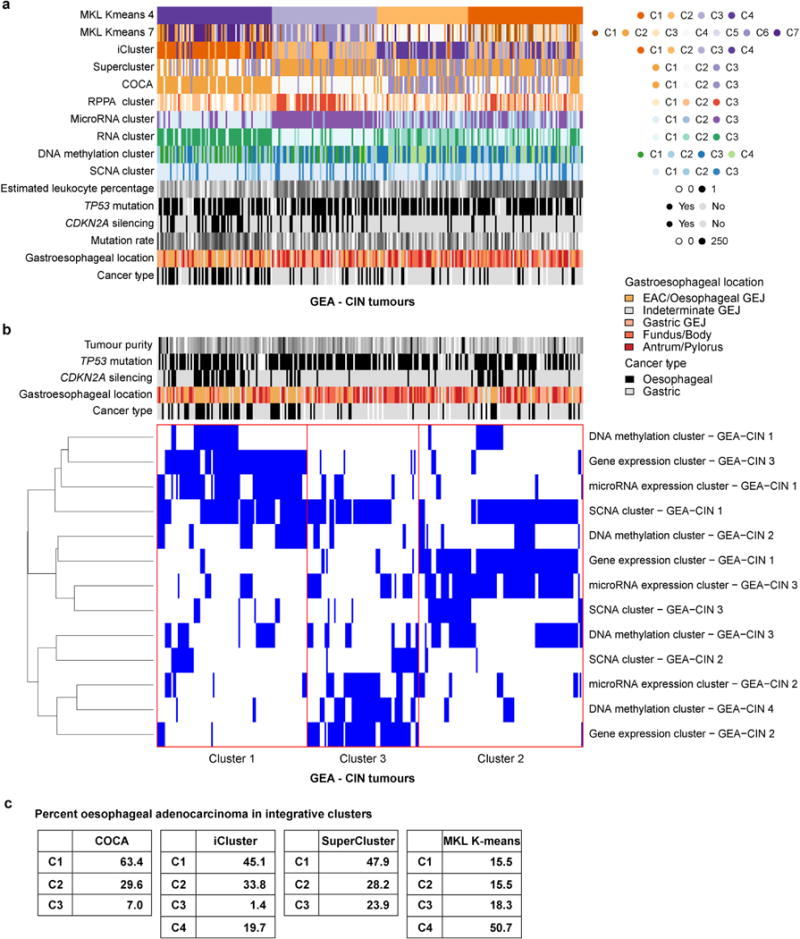
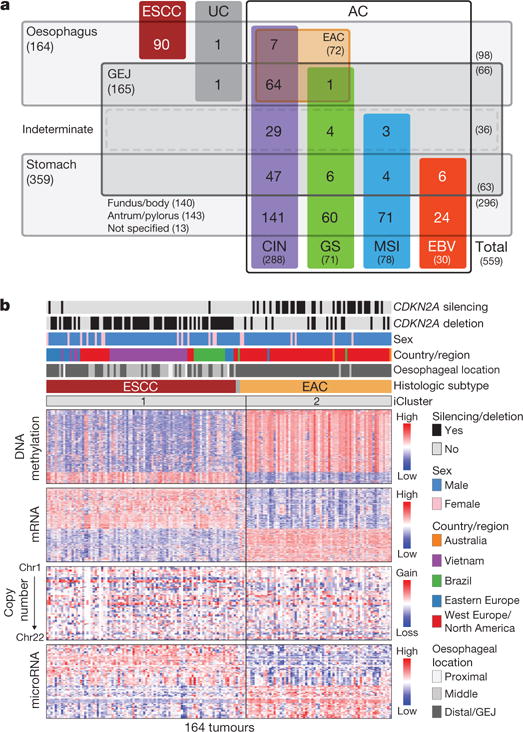
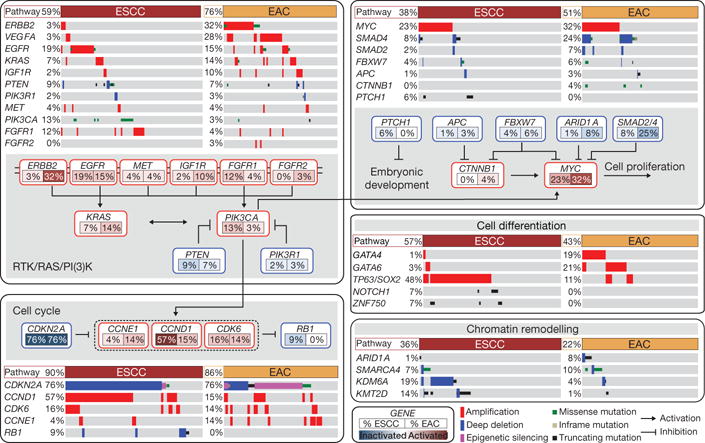
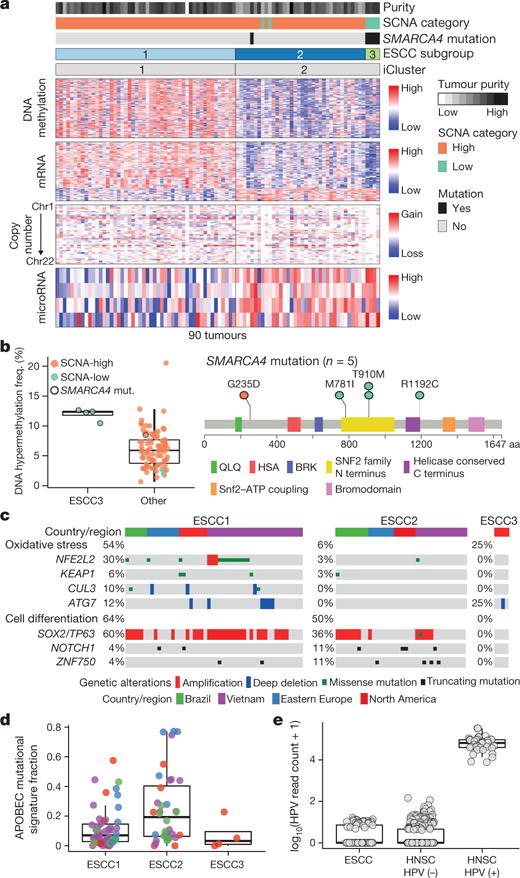
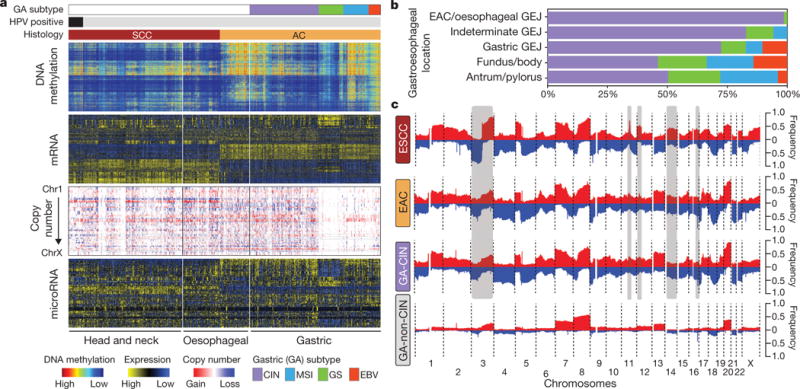
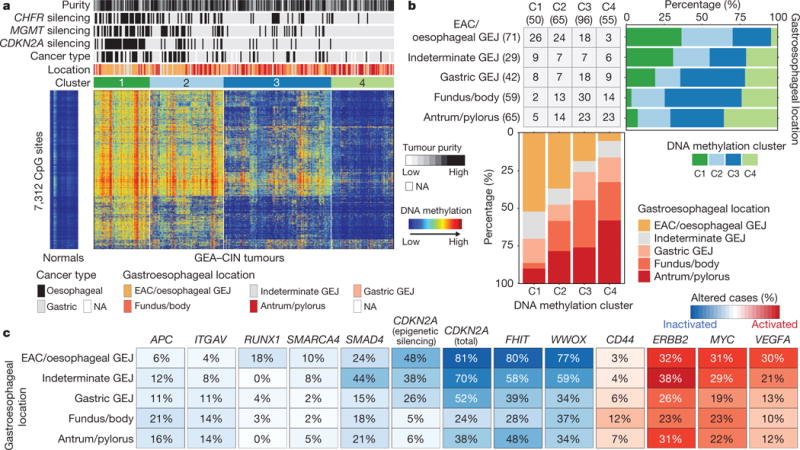
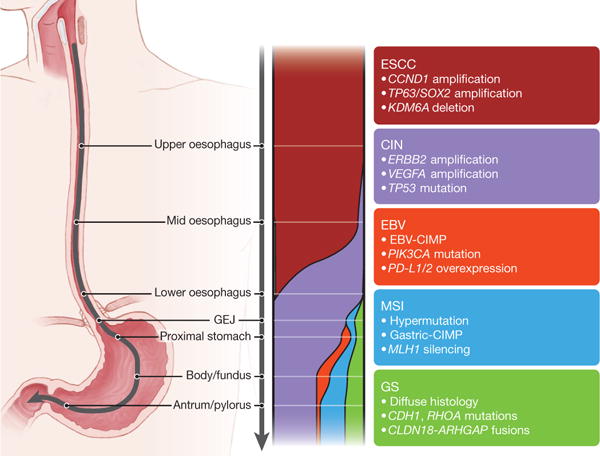
Oesophageal cancers are prominent worldwide; however, there are few targeted therapies and survival rates for these cancers remain dismal. Here we performed a comprehensive molecular analysis of 164 carcinomas of the oesophagus derived from Western and Eastern populations. Beyond known histopathological and epidemiologic distinctions, molecular features differentiated oesophageal squamous cell carcinomas from oesophageal adenocarcinomas. Oesophageal squamous cell carcinomas resembled squamous carcinomas of other organs more than they did oesophageal adenocarcinomas. Our analyses identified three molecular subclasses of oesophageal squamous cell carcinomas, but none showed evidence for an aetiological role of human papillomavirus. Squamous cell carcinomas showed frequent genomic amplifications of CCND1 and SOX2 and/or TP63, whereas ERBB2, VEGFA and GATA4 and GATA6 were more commonly amplified in adenocarcinomas. Oesophageal adenocarcinomas strongly resembled the chromosomally unstable variant of gastric adenocarcinoma, suggesting that these cancers could be considered a single disease entity. However, some molecular features, including DNA hypermethylation, occurred disproportionally in oesophageal adenocarcinomas. These data provide a framework to facilitate more rational categorization of these tumours and a foundation for new therapies.


Conflict of interest statement

The authors declare no competing financial interests.

Figures

Extended Data Figure 1
Extended Data Figure 1. Platform-specific unsupervised clustering analyses of oesophageal cancers
a–e, Unsupervised clustering of oesophageal cancers based on DNA hypermethylation (a), SCNAs (b), gene expression profiles (c), microRNA profiles (d) and reverse-phase protein array data (e) revealed strong separation between EAC and ESCC in multiple molecular platforms. Samples are displayed as columns. EAC, oesophageal adenocarcinoma; ESCC, oesophageal squamous cell carcinoma; UC, undifferentiated carcinoma.
Extended Data Figure 2
Extended Data Figure 2. Pathways with significant expression differences between EAC and ESCC
a, NCI PID pathways in which expression differs significantly between EAC and ESCC (Ps < 10−3, where Ps is the statistical significance of the pathway score (see Methods)) are listed. The colour scale shows the median (log2) expression value of significantly differentially expressed genes (P < 10−3) in the corresponding pathway, normalized to unit range. b, TP63ΔN transcript levels were measured in EAC, solid tissue normal, and ESCC samples. c, Median gene expression values of genes in the NCI-PID pathway ‘Validated transcriptional targets of the ΔN p63 isoforms’ in EAC and ESCC. Each point represents one sample, and the value is the median expression value of the 46 genes in the pathway.
Extended Data Figure 3
Extended Data Figure 3. MutSig analyses of significantly mutated genes in EAC and ESCC
a, Plot of significantly mutated genes from the MutSigCV2 computational analysis of whole-exome sequencing data from EAC samples. Genes are ordered by level of significance (q value as plotted at right). At left is the prevalence of each mutation in the sample set. The coloured boxes show samples with specific mutations, with the type of mutation labelled by box colour, with legend at upper right. The top plot shows the number of mutations per sample with synonymous (Syn.) and non-synonymous (Non syn.) mutations plotted separately. The bottom plot shows the distribution of allelic fraction of mutations for the samples sequenced. b, The MutSig plot for ESCC is shown the same as for the EAC samples above.
Extended Data Figure 4
Extended Data Figure 4. GISTIC analysis of foci of recurrent amplification and deletion
These figures demonstrate foci of significantly recurrent focal amplification and deletion as determined from GISTIC 2.0 analysis of somatic copy number data from SNP arrays. Separate plots are shown for CIN-gastric cancer (left), EAC (middle) and ESCC (right). Each plot arrays the chromosomes from 1 (top) to X (bottom) and shows foci of significant amplification (left, red with scale at bottom) or deletion (right, blue with scale at top). Candidate targets of each focus of amplification or deletion are shown in the label for the respective peak. Peaks without clear targets are labelled by chromosome band. The number in parentheses indicates the number of genes in each peak as calculated by GISTIC. Genes marked with asterisks are likely drivers located adjacent to peak areas defined by GISTIC.
Extended Data Figure 5
Extended Data Figure 5. Comparison of somatic alterations in ESCC and HNSC subtypes
Mutations and copy-number changes for selected genes in selected signalling pathways are shown for the three ESCC subtypes identified in our study and the HPV-negative (n = 243) and HPV-positive (n = 36) subtypes that had previously been identified by TCGA in the HNSC study. Amplifications and deep deletions indicate a change of more than half of the baseline gene copies. Missense mutations were included if they were found in the COSMIC repository. Alteration frequencies are expressed as percentage of altered cases within each molecular subtype. Bottom panels show percentage of altered cases per signalling pathway for each molecular subtype and percentage of altered cases per molecular subtype for each signalling pathway.
Extended Data Figure 6
Extended Data Figure 6. Distinct clusters of ESCC
Columns indicate Pearson correlation between each of the mRNA profiles of 90 ESCC tumours with the centroids of the mRNA expression profiling subtypes that were developed for lung squamous cell carcinoma (LUSC, top) and head and neck squamous cell carcinoma (HNSC, bottom) gene expression analyses. Samples are in ESCC cluster order as in Fig. 3a.
Extended Data Figure 7
Extended Data Figure 7. Characterization of ESCC subtypes
a, We identified genes exhibiting epigenetic silencing in individual samples and compared the number of samples where each gene was silenced in ESCC1 and ESCC2. Genes that showed statistical associations between number of silenced samples and ESCC subtypes are shown in the table (P < 0.01, Fisher’s exact test). Two genes remained significant after Bonferroni correction. The panel on the right shows DNA methylation versus gene expression for BST2 and SH3TC1. b, A detailed analysis of BST2 DNA methylation in ESCC samples and non-cancer controls. c, d, The plots of (c) estimated leukocyte fraction and (d) levels of cleaved caspase-7 protein show the median, 25th and 75th percentile values (horizontal bar, bottom and top bounds of the box), and the highest and lowest values within 1.5 times the interquartile range (top and bottom whiskers, respectively).
Extended Data Figure 8
Extended Data Figure 8. EACs are more similar to CIN-type gastric adenocarcinomas than to other gastric subtypes
a, b, Integrative clustering of platform-specific clusters for gastroesophageal adenocarcinomas (GEA) was performed using the SuperCluster method (a) and Clustering of Cluster Assignments (COCA) (b).
Extended Data Figure 9
Extended Data Figure 9. Platform-specific unsupervised clustering analyses of GEA-CIN tumours
a–d, Shown are heat map representations of gene expression (a), microRNA (b), SCNAs (c), and reverse-phase protein array profiles of GEA-CIN tumours (columns) (d).
Extended Data Figure 10
Extended Data Figure 10. Integrative clustering of GEA-CIN samples
a, Integrative clustering by Multiple Kernel Learning: k-means (MKL k-means) yielded a four cluster solution, in which Cluster 4 is enriched for EAC. b, Clustering of Cluster Assignments (COCA), was performed for the 267 samples for which complete platform-specific cluster information (see Fig. 5a, Extended Data Fig. 8) was available for gene expression, microRNA expression, DNA methylation and somatic copy number alteration (SCNA), and yielded three integrative clusters. Details of the methods can be found in Supplementary section S10.2. c, Frequency of EAC in four integrative clustering methods. Integrated clustering with iCluster and SuperCluster was performed as described in Methods.
Figure 1
Figure 1. Major subdivisions of gastroesophageal cancer
a, 559 oesophageal and gastric carcinoma tumours were categorized into sample sets. CIN, chromosomal instability; EBV, Epstein–Barr virus; GEJ, gastroesophageal junction; GS, genomically stable; MSI, microsatellite instability. UC, undifferentiated carcinoma. b, Integrated clustering of four molecular platforms shows that oesophageal carcinomas fall into two molecular subtypes (iCluster 1 and iCluster 2) that are virtually identical to histological classes ESCC and EAC. Clinical (top) and molecular data (bottom) from 164 tumours profiled with all four platforms are depicted.
Figure 2
Figure 2. Integrated molecular comparison of somatic alterations across oesophageal cancer
Mutations and SCNAs for selected genes and CDKN2A epigenetic silencing are shown for EACs and ESCCs. Genes are grouped by pathways, with lines and arrows showing pairwise molecular interactions. Deep deletions indicate loss of more than half of gene copies. Only missense mutations reported in the COSMIC repository are included. Alteration frequencies for each gene are listed inside rounded rectangles with ESCC rates on left and EAC on right, with red shading denoting gene activation, and blue denoting inactivation.
Figure 3
Figure 3. Distinct molecular subtypes of oesophageal squamous cell carcinoma
a, ESCCs separated into subtypes ESCC1 and ESCC2 by iCluster, with identification of an additional group ESCC3 having SMARCA4 mutations and reduced SCNAs. Clinical and molecular features are listed at top with molecular data at bottom. b, Left, DNA hypermethylation in ESCC3 and other ESCCs. Right, SMARCA4 mutations. c, Genomic alterations that affect oxidative stress and cell differentiation in ESCC subtypes with samples segregated by geographic origin. d, Fraction of mutations with APOBEC signature by subtype and geographic origin. e, Human papilloma virus (HPV) transcript levels in oesophageal and head and neck SCCs.
Figure 4
Figure 4. Similarity of oesophageal adenocarcinoma and CIN variant of gastric cancer
a, Molecular profiles of head and neck, oesophageal and gastric carcinomas with samples segregated by tumour type and gastric cancers subdivided by molecular subtypes. b, Distribution of gastric molecular subtypes by anatomic location across gastroesophageal adenocarcinomas. c, Composite copy number profiles for ESCC, EAC, gastric-CIN and gastric non-CIN tumours with gains in red and losses in blue and grey highlighting differences between ESCC and EAC.
Figure 5
Figure 5. Molecular features of CIN gastroesophageal adenocarcinomas by anatomic location
a, Heat map representation of consensus clustering of DNA methylation of GEA-CIN tumours with molecular and clinical features shown above and methylation profiles of normal oesophagus (n = 2) and stomach (n = 13) on the left. b, Fraction of tumours belonging to each methylation subgroup by anatomic location (top right) and distribution of tumour anatomic location by methylation cluster (bottom). c, Frequency of alterations in selected genes along the anatomic axis with tumour suppressor inactivation in blue and oncogene activation in red.
Figure 6
Figure 6. Gradations of molecular subclasses of gastroesophageal carcinoma
Schematic representing shifting proportion of subtypes of gastroesophageal carcinoma from the proximal oesophagus to the distal stomach. The widths of the colour bands represent the proportion of the subtypes present within anatomic regions. Key features of subtypes are indicated in associated text.

Comment in

  • Cancer genomics: Spot the difference.
    Peyser ND, Grandis JR. Peyser ND, et al. Nature. 2017 Jan 12;541(7636):162-163. doi: 10.1038/nature21112. Epub 2017 Jan 4. Nature. 2017. PMID: 28052059 No abstract available.
  • Not All Esophageal Tumors Equal.
    [No authors listed] [No authors listed] Cancer Discov. 2017 Mar;7(3):238. doi: 10.1158/2159-8290.CD-NB2017-006. Epub 2017 Jan 19. Cancer Discov. 2017. PMID: 28104797
  • Genetics: Oesophageal cancer - not all alike.
    Romero D. Romero D. Nat Rev Clin Oncol. 2017 Mar;14(3):138. doi: 10.1038/nrclinonc.2017.9. Epub 2017 Jan 24. Nat Rev Clin Oncol. 2017. PMID: 28117415 No abstract available.

References

    1. De Angelis R, et al. Cancer survival in Europe 1999–2007 by country and age: results of EUROCARE—5-a population-based study. Lancet Oncol. 15:23–34. - PubMed
    1. Siegel RL, Miller KD, Jemal A. Cancer statistics, 2016. CA Cancer J Clin. 2016;66:7–30. - PubMed
    1. Torre LA, et al. Global cancer statistics, 2012. CA Cancer J Clin. 65:87–108. - PubMed
    1. Siewert JR, Ott K. Are squamous and adenocarcinomas of the esophagus the same disease? Semin Radiat Oncol. 2007;17:38–44. - PubMed
    1. Brown LM, Devesa SS, Chow WH. Incidence of adenocarcinoma of the esophagus among white Americans by sex, stage, and age. J Natl Cancer Inst. 2008;100:1184–1187. - PMC - PubMed

Publication types

MeSH terms

Supplementary concepts

Grants and funding